| Mixer Type | Image | Levels | Phase | Timing | Summing |
|---|---|---|---|---|---|
| Allen and Heath Avantis |
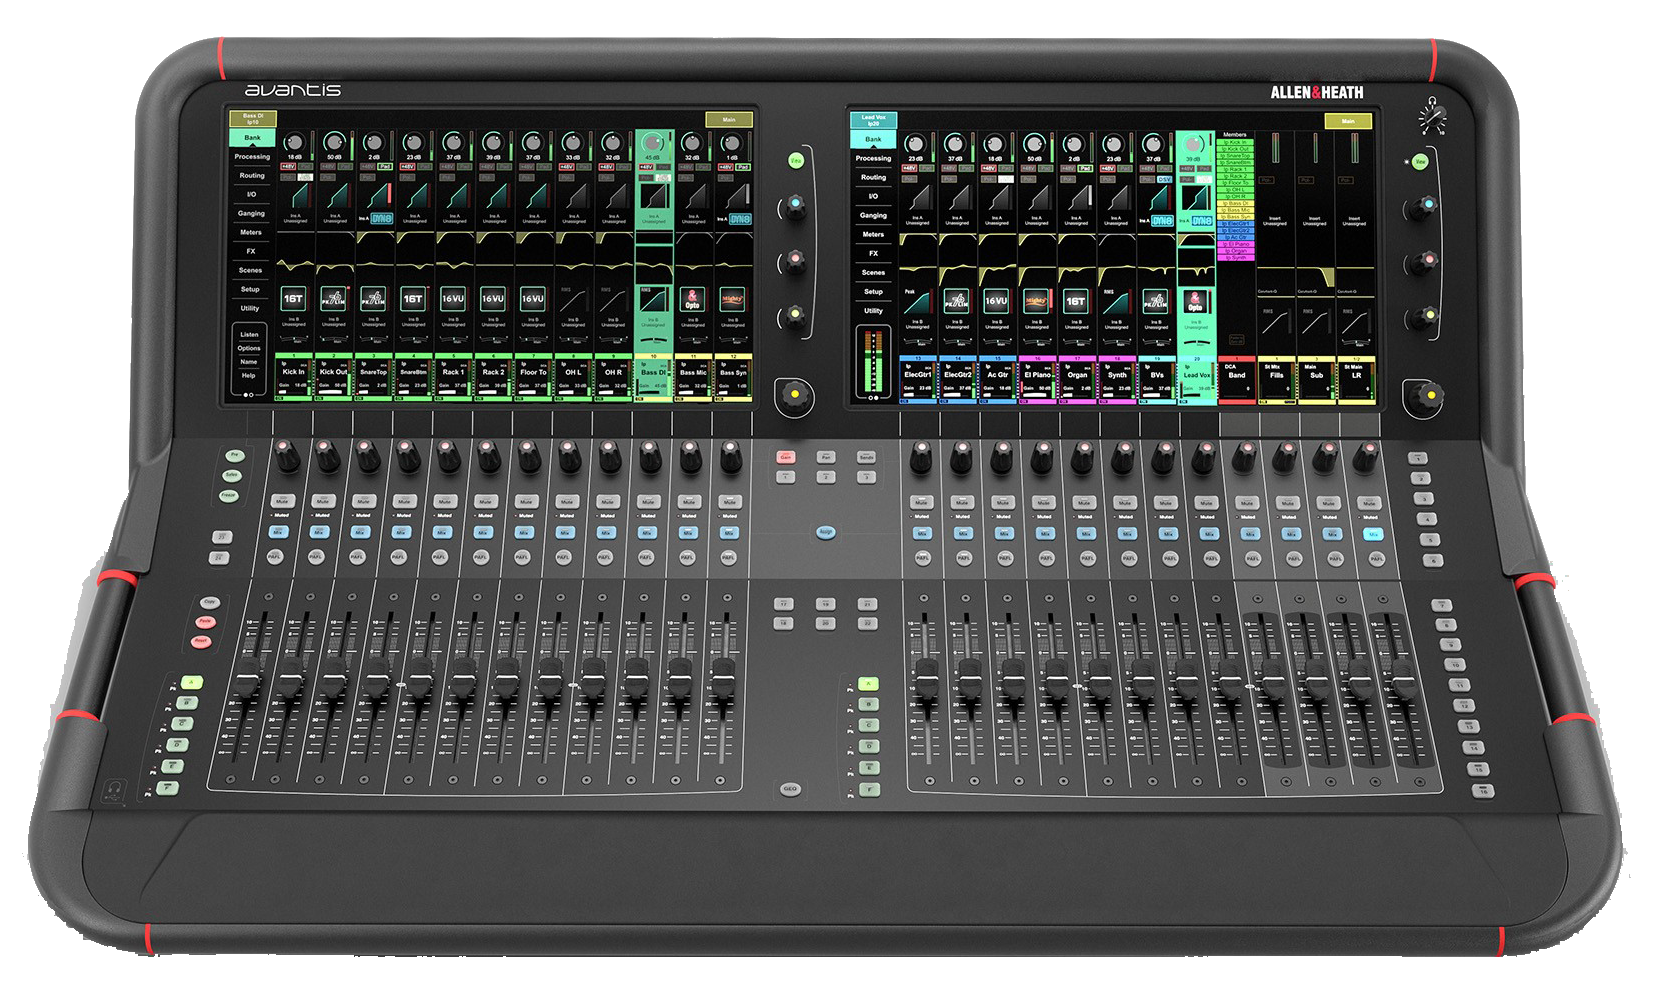
| ||||
| Allen and Heath SQ-6 |
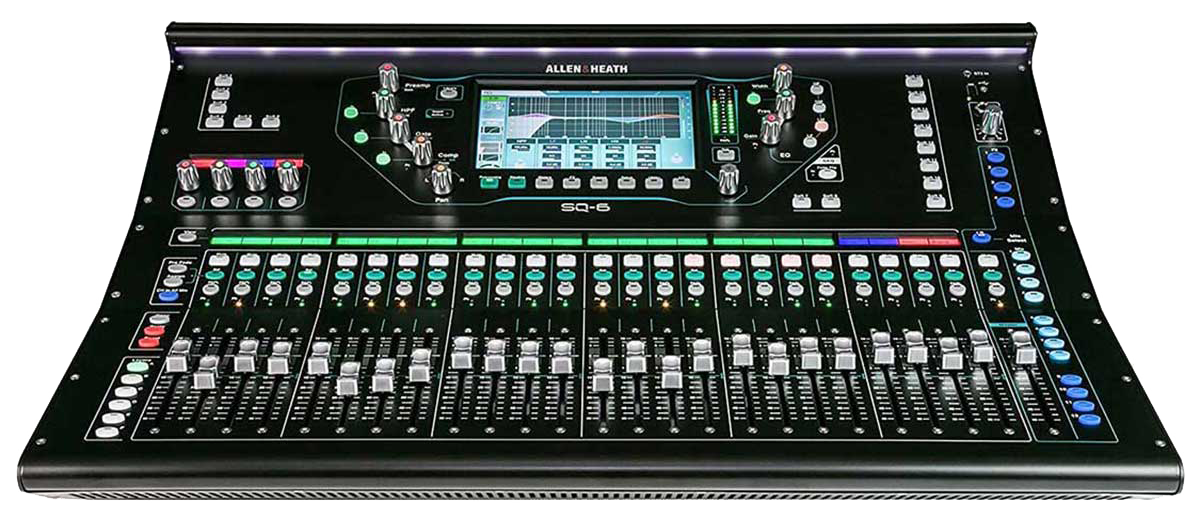
| ||||
| APB Dynasonics ProRack H1020 |
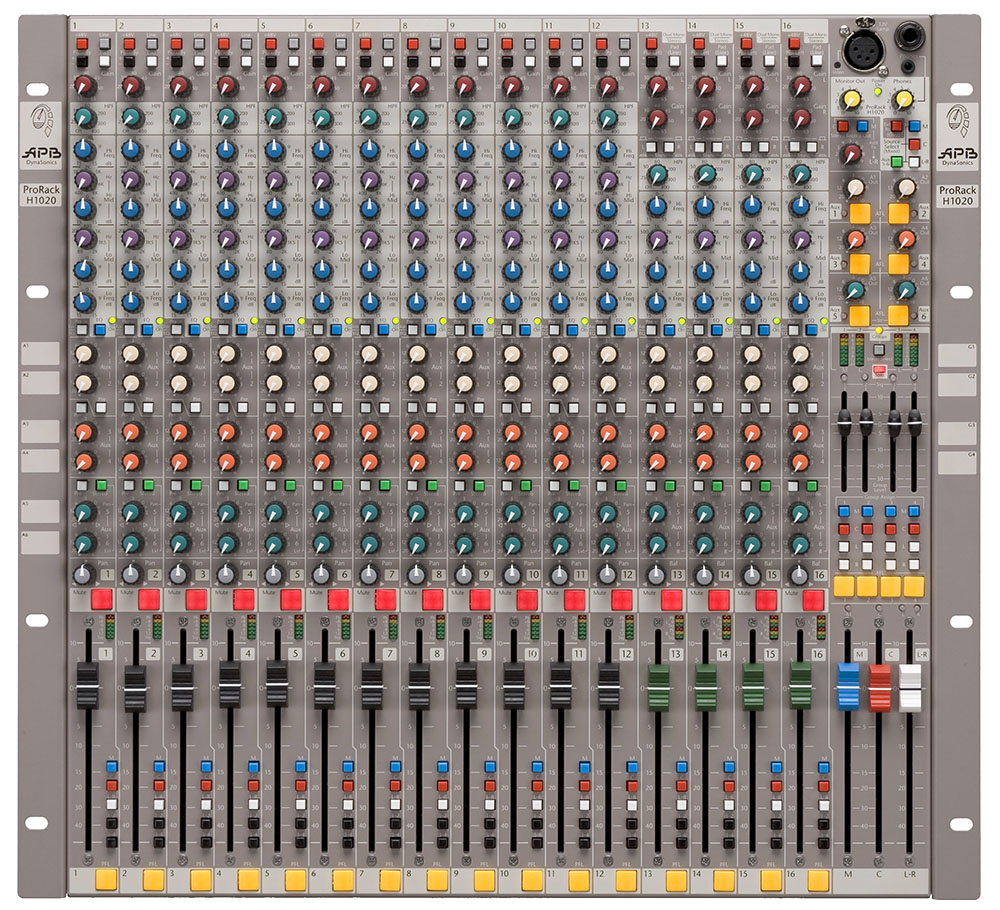
| ||||
| Behringer XR18 |
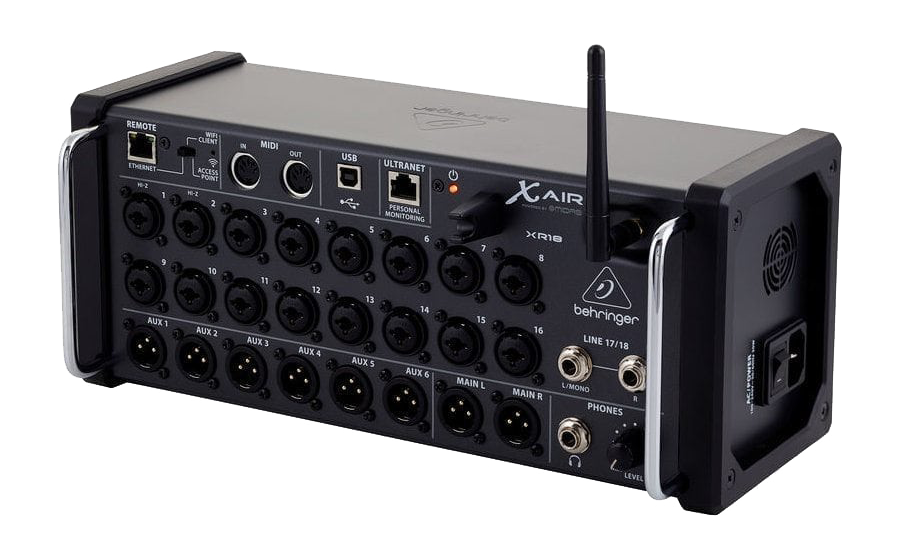
| ||||
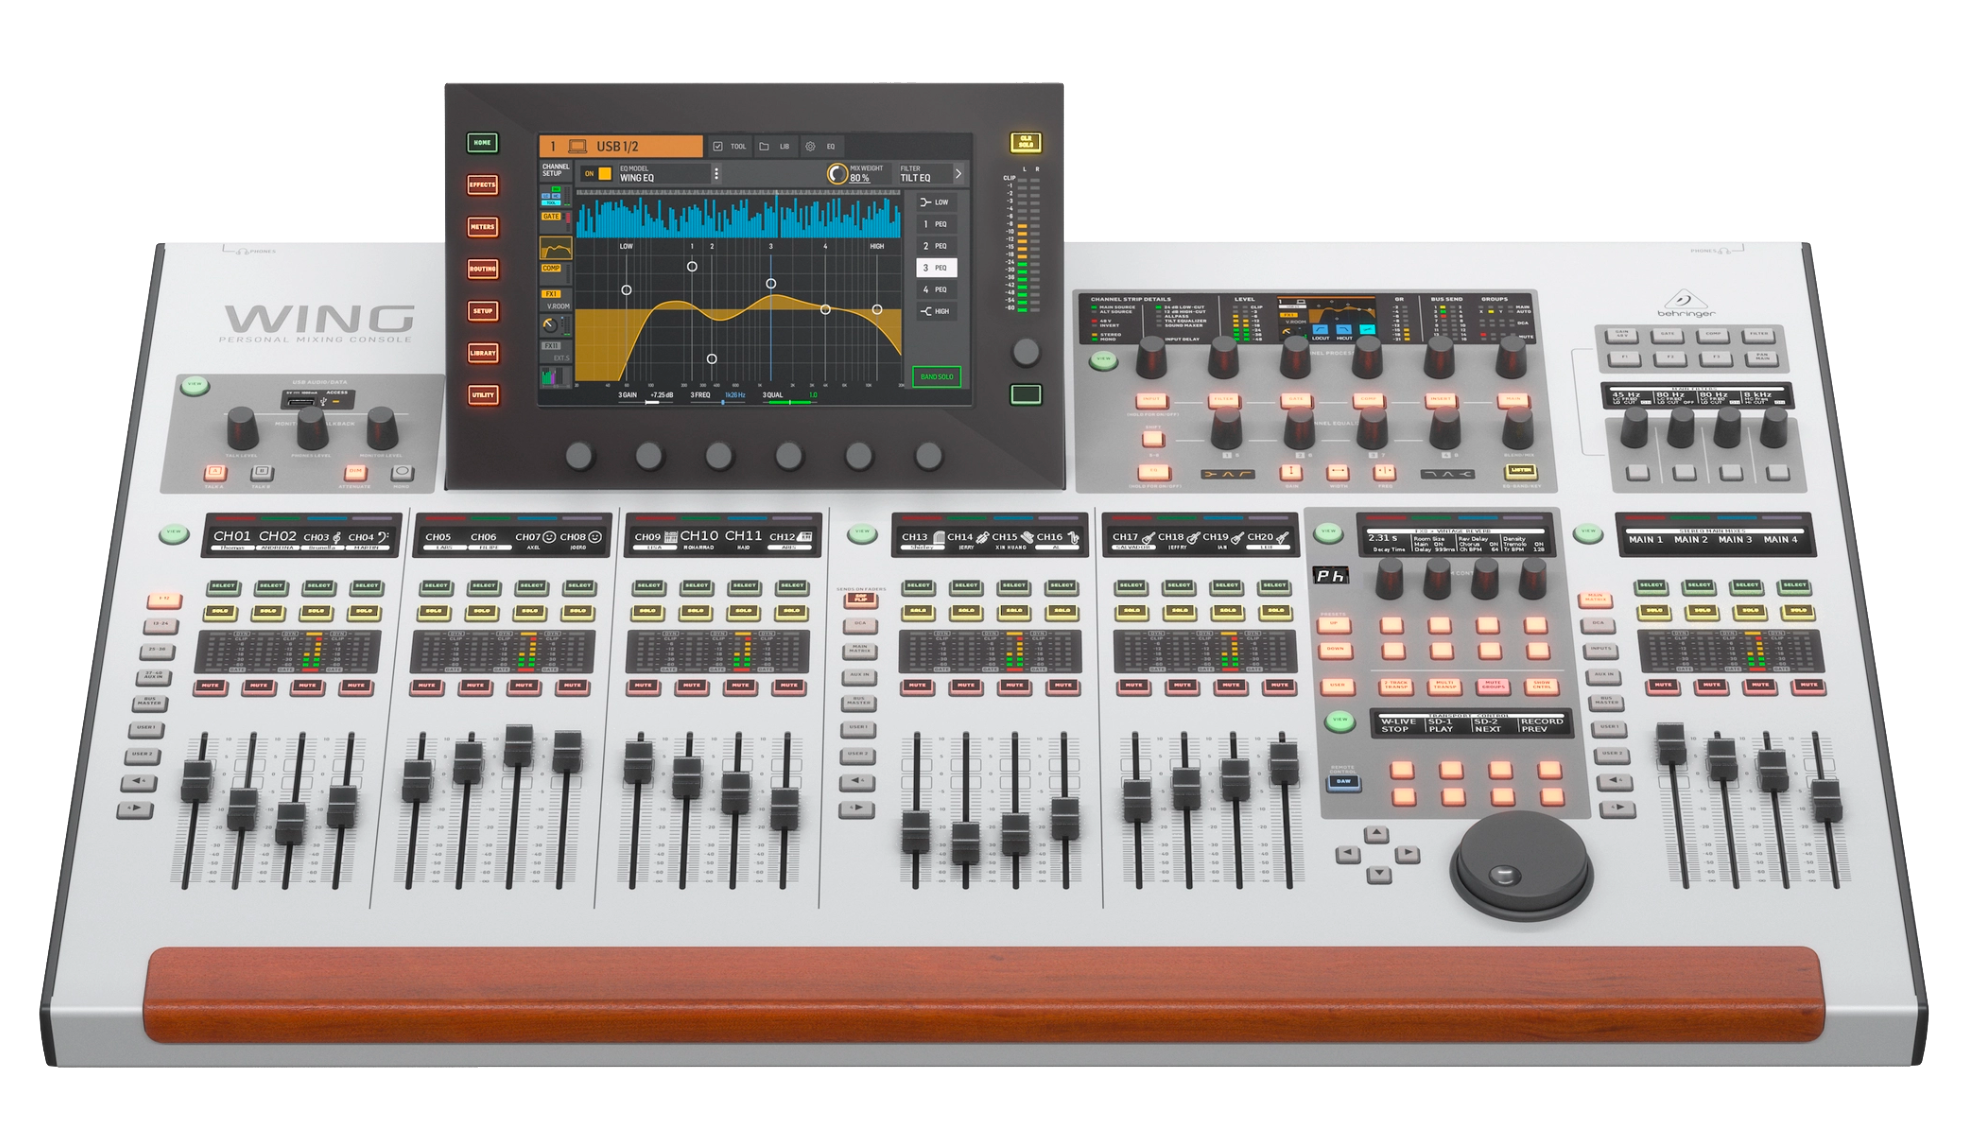
| Behringer Wing |
| ||||
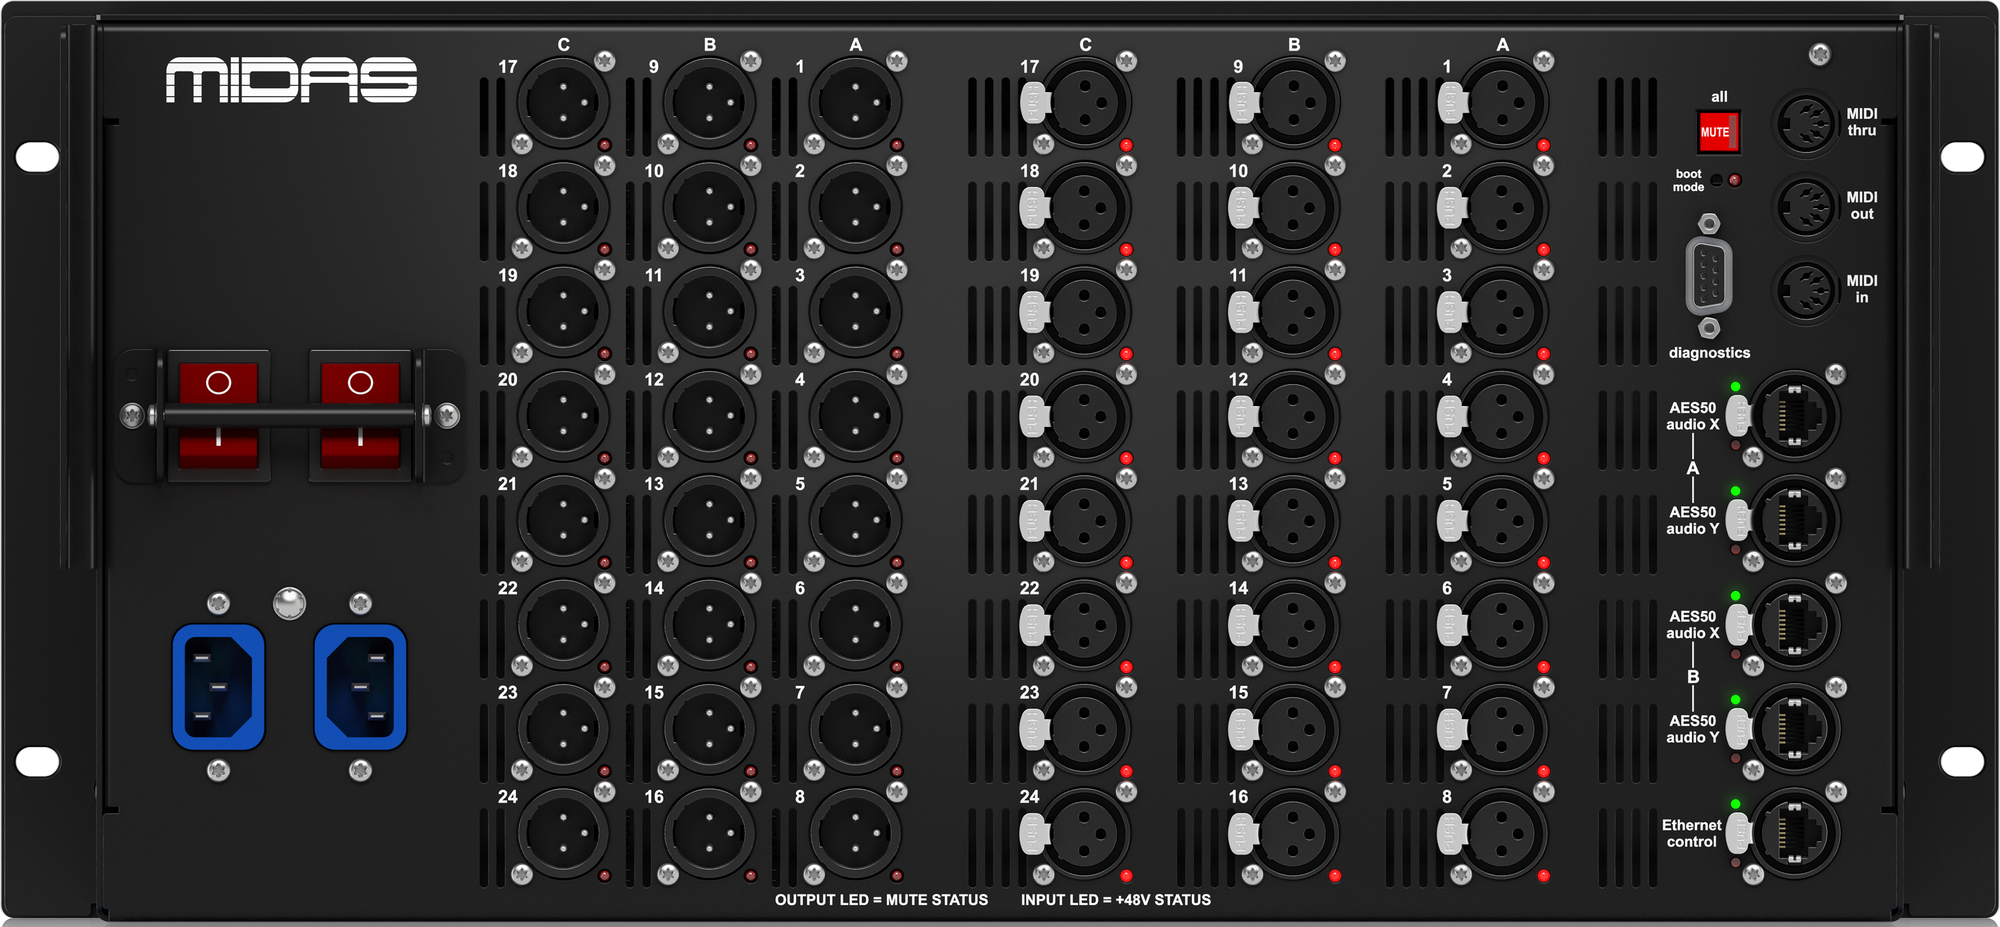
| Behringer Wing+Midas DL231 Stagebox |
| ||||
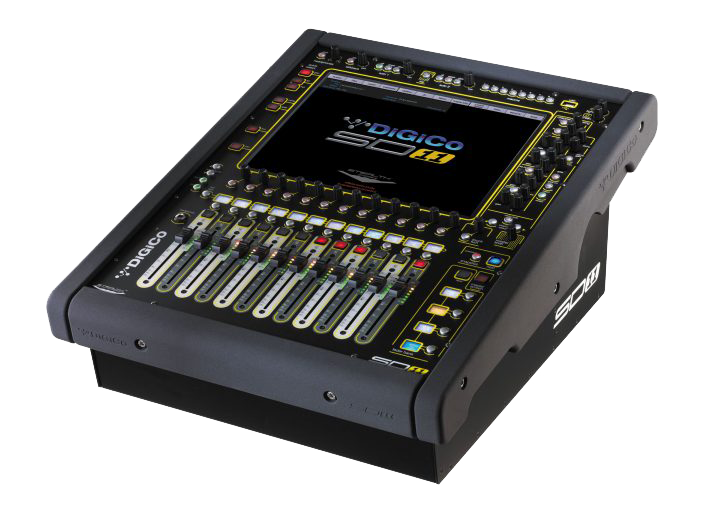
| Digico SD11 48 kHz |
| ||||
| Digico SD11 96 kHz |

| ||||
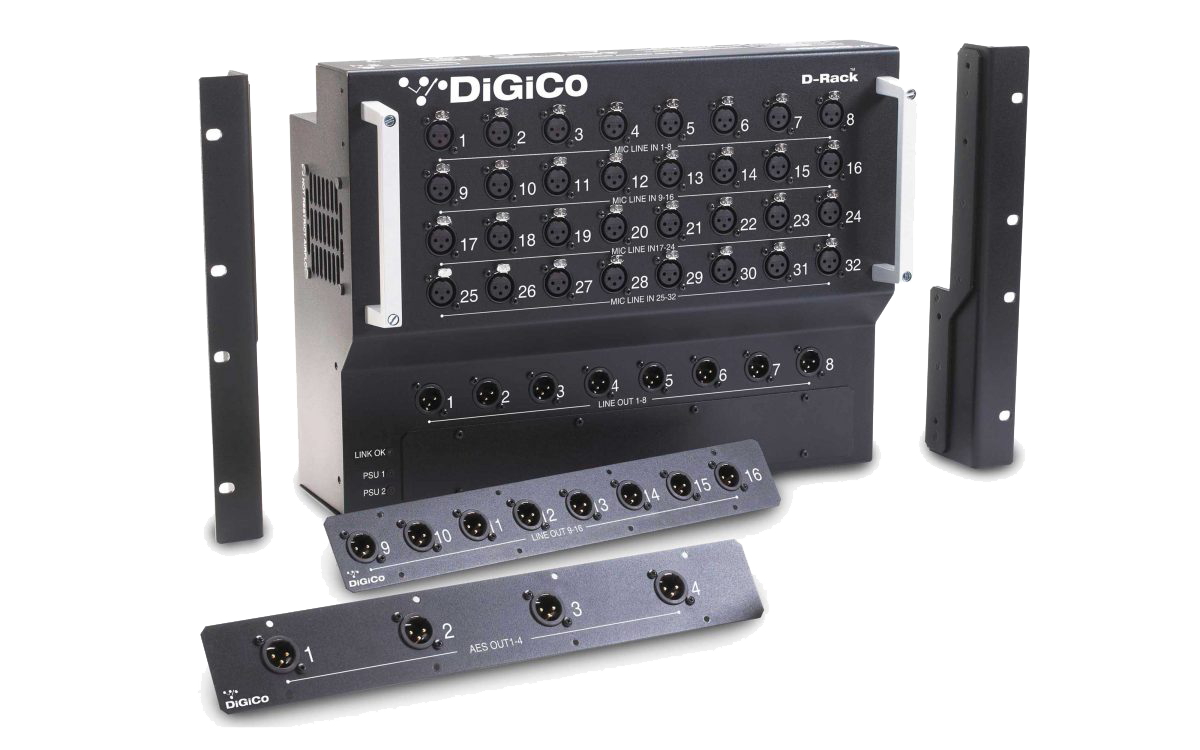
| Digico SD11+D-Rack Stagebox 48 kHz |
| ||||
| Midas M32R |
| ||||
| Midas Pro 2 |
| ||||
| Midas Pro 2+Midas DL251 Stagebox |
| ||||
| Soundcraft Signature 10 |
| ||||
| Soundcraft Ui24 |
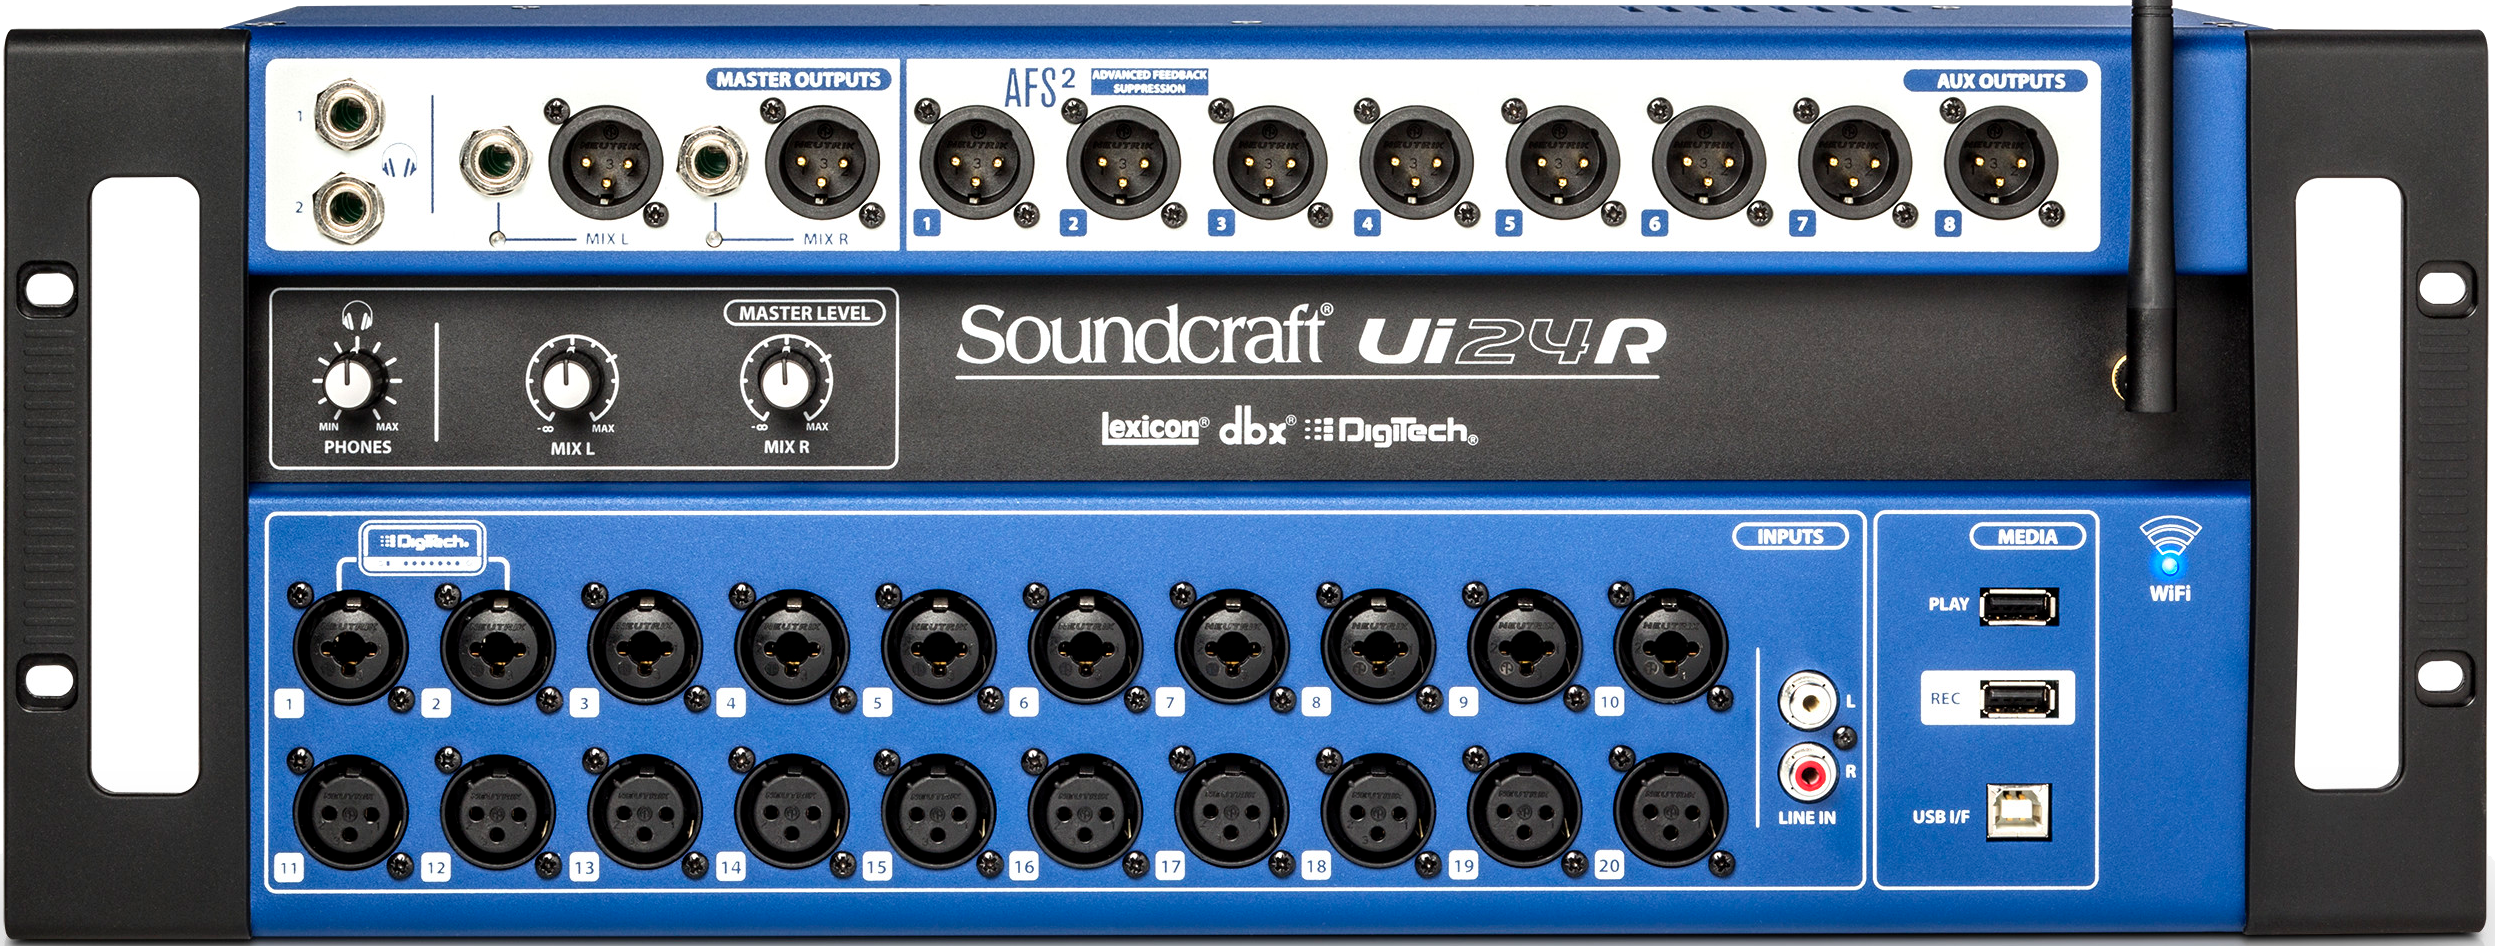
| ||||
| Yamaha QL1 |
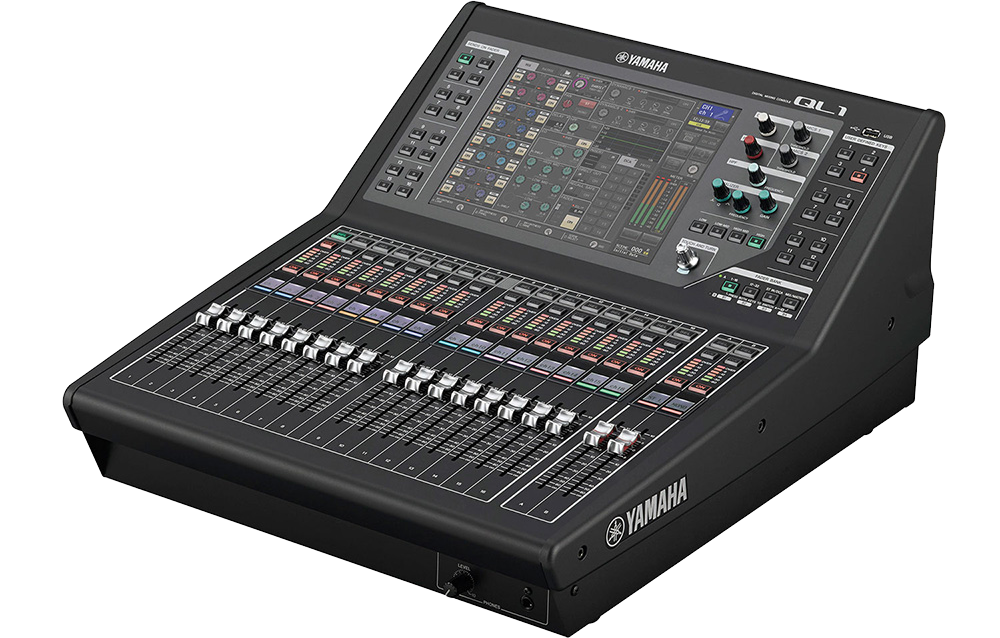
| ||||
| Yamaha QL1+RIO3224-D2 Stagebox |
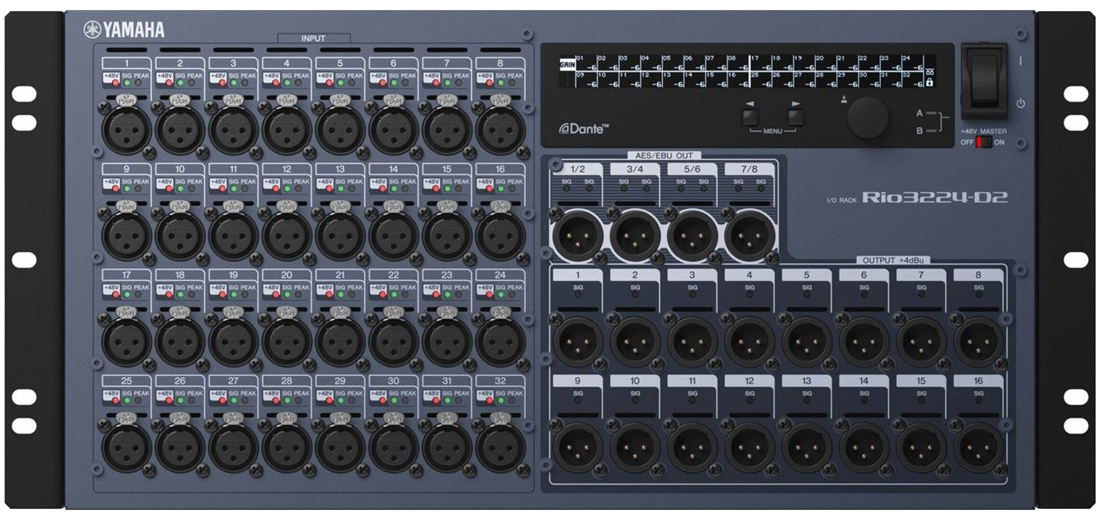
|
Potential Timing Issues?
Digital Mixer Study
by Pat Brown
Introduction
All mixers modify the signals that pass through them. Even with the controls “zeroed” the changes to bandwidth, phase, and timing can be observed by comparing the output signal to the input signal. There will also be the introduction of noise and possibly electromagnetic interference (EMI). This study compares these attributes for a lineup of contemporary mixers.
The project was conceived and organized by Doug Woosley of Sound Ideas. His roles as integrator and FoH sound guy give him the opportunity to mix on various digital consoles. On multiple occasions he has noticed significant tonal coloration when following some commonly-used routing practices on digital mixers, such as routing a channel to an output bus via multiple paths. His ears told him something was wrong, and this study was designed to find out what. The mixer lineup included stock items along with samples provided by manufacturers. I scripted and performed the tests, and formatted the results for presentation. Dennis Birkemeier produced the results matrix.
If you want to bypass the rest of this article and cut to the chase, you can click on the “Summing” plot in the matrix for each mixer. If you see a comb filter (a series of peaks and nulls in the response) then there is a routing configuration for that mixer that should be avoided. The “Timing” tab will show the routing that produced it. The Timing and Summing plots are color-coded the same (e.g. green plot in Summing corresponds with green plot in Timing).
Let’s move on.
Additional Tests
The main objective of the study was to investigate timing issues. We performed additional tests to evaluate some other responses. Out of the very large number of tests that could have been performed, we selected the frequency response magnitude, frequency response phase, EMI susceptibility, common-mode rejection (CMRR), and timing, with the timing information presented in both the time and frequency domains.
At left is a matrix that presents the test results. Selecting any of the plots reveals a tabbed report of vector graphics plots for each mixer. The tabs are Levels, Phase, Timing, and Summing. Here’s a description of each.
Levels Tab
The Levels tab presents a number of measures in the frequency domain. These include the frequency response magnitude (blue), EMI susceptibility (red), noise floor (grey), ideal CMRR (orange), and the CMRR with an imbalanced source (blue and green) (Figure 1).
Each mixer was tested under identical conditions. The same send and receive cable was moved from mixer to mixer. The input signal was -20 dBV and the mixer gain was set to 30 dB. This produced a +10 dBV output from the mixer – a strong line level signal that should fall short of causing any non-linearities such as clipping, limiting, or compression.
The plots on the Levels tab were smoothed at 1/12-octave by the analyzer to make them more readable and relevant to what can be perceived by human hearing. The frequency range limits for the frequency response magnitude were the maximum achievable with the Audio Precision APx515 analyzer (2 Hz – 80 kHz). The band limits were reduced for the CMRR, noise floor, and EMI susceptibility tests, zooming in on the part of the spectrum where power line noise is the typically the culprit. This makes it much easier to compare the results without being distracted by data that is outside of the scope of the study.
Figure 1 – Key for the Levels tab
Frequency Response Magnitude
All mixers are band pass filters. This means that there is necessarily a high pass response at the low frequency end of the spectrum and a low pass response at the high frequency end. This is a good thing, since a “DC to daylight” response could allow all sorts of parasitic junk to enter the mixer and be amplified.
Some of the mixers have a gentle frequency roll-off at the frequency extremes. Others have a brick wall response. These reflect both the philosophy of the mixer’s designer and the limitations on bandwidth imposed by the mixer’s sample rate.
Noise Floor
It is important to realize that no perfect electronic components exist. All will have residual noise. Note that the level plot shows a 140 dB range (+20 dBV at top, -120 dBV at bottom) with the signal level near the top and the residuals near the bottom.
This underscores the importance of establishing a good component and system gain structure. If an artifact is at -80 dB relative to the signal, it is not likely to be audible unless your gain structure makes it audible. The objective is not the absence of noise, but the inaudibility of noise. The noise floor plot (grey) shows the output of the mixer with no input signal.
Pin 1
When multiple “ground” paths exist between audio components, parasitic currents can flow through them and enter an audio device via the cable shield connections on the analog input and output jacks. These “ground loops” have been the bane of the audio practitioner for decades.
The “Pin 1” test is based on AES48 and the research of Ralph Morrison, Neil Muncy, Bill Whitlock, Ray Rayburn and others. It is designed to reveal a susceptibility to these shield currents at power line frequencies. To perform the test we deliberately injected a parasitic current into the input shield connection (pin 1 on the XLR jack). A measurement was made of the output with no input signal, with pins 2 and 3 connected through a 100 ohm resistor, simulating the presence of an ideal source.
The parasitic signal is a half-wave rectified 60 Hz sine wave at 100 mA (Figure 2). This produces a 60 Hz fundamental and a string of harmonics, emulating the parasitic currents that circulate around the ground paths of a sound system.
Figure 2 – The pin 1 test signal
In the ideal case, the spectrum of output noise floor would be unchanged. In the real world the parasitic signal may show up, indicating a susceptibility to Shield-Current-Induced-Noise (SCIN). This susceptibility has been dubbed the “Pin 1 Problem” and in severe cases steps may need to be taken to mitigate the resultant hum and buzz.
The presence of the parasitic signal in the noise floor suggests that special precautions may be necessary for channels that may have a ground loop condition, such as when driven from another device that is powered by a different electrical outlet than the mixer. Common solutions include the “lifting” of cable shields at balanced inputs, and the use of EMC XLR connectors.
Common Mode Rejection Ratio (CMRR)
The CMRR describes the ability of a balanced input (or output) to reject a signal that is identical on the plus and minus terminals. Such a signal is termed common mode and it should be rejected by the input. Signals that are different between the input terminals are differential mode and should be accepted by the input (Figure 3). A balanced output driving shielded twisted-pair cable is designed to render parasitic interference signals as common mode and the desired audio signal as differential mode.
The orange trace on the Levels plot shows the ideal CMRR through the power-line frequency range. Ideal in this case means that the driving source (the analyzer) has an instrumentation-grade output impedance balance, meaning that the output impedances looking back into the plus and minus terminals are exquisitely matched. Unfortunately, this is not typically the case due with audio gear due to design philosophy and component tolerances, so an additional CMRR test was warranted.
Figure 3 – Signal modes for a balanced input
CMRR Imbalance
Bill Whitlock has pointed out that in the real-world few outputs are perfectly balanced, and any imbalance can impair the CMRR of an electronically-balanced input. The CMRR Imbalance test was formulated by Whitlock to reveal the CMRR of an input under real-world conditions. The ideal CMRR test is repeated but with a 10 ohm resistor placed in series with pin 2 and pin 3 respectively. Any degradation of the ideal CMRR can be observed on the plot.
Solutions to CMRR reduction due to source impedance imbalance include high quality input transformers and special analog IC chips.
Phase Tab
When one observes a phase plot for any device, they are viewing a response that has multiple contributors. These are
Delay
Phase Shift
Polarity
One must perform some forensics to isolate these effects. The multiple paths through a mixer can be time-coherent (identical delay per path, referred to as latency), phase-coherent (identical phase response per path), or polarity-coherent (identical polarity per path). For example, two paths can have an identical phase response, but different latency. They can also have identical latency, but one path could exhibit phase shift. And lastly, the latency and phase responses can be identical, but one (or both) paths could invert the signal polarity. A phase plot cooks all of these responses together, so we must pick them apart.
The most common first step is to remove the delay by subtracting a time interval. This “latency compensation” can be done automatically by most analysis platforms.
Once the delay is removed, the phase shift and polarity remain. The polarity can usually be determined by observing whether the mid band phase response crosses through 0 deg or +/- 180 deg. This is typically pretty obvious for broad bandwidth, linear response devices such as mixers and amplifiers. It’s less obvious for devices that introduce significant phase shift, such as multi-way loudspeakers that use high-order analog or IIR digital crossovers.
An important distinction is that two of these contributors, delay and polarity, do not alter the shape of the waveform. Delay slides the waveform down the time axis, and polarity inverts it. In contrast, phase shift changes the wave shape by wrapping it around the time axis in a frequency-dependent manner. The audibility of this “phase distortion” has been hotly debated for decades.
The ideal phase response is a flat line. This is linear phase. It means that the device does not cause a phase shift between the various frequencies that pass through it, allowing the shape of a waveform to be preserved. A square wave played into the input would look like a square wave at the output.
One reason that the frequency response of a mixer extends beyond the 20 Hz – 20 kHz audible spectrum is to maintain a linear phase response out to these frequency extremes. All of the mixers tested would do a good job of preserving the shape of a square wave, but all would delay it by a different amount. One mixer inverts the signal polarity.
Timing Tab
The original objective of this study was to evaluate how signals that are routed to a main bus via different paths mix together. Any timing differences can destroy the mixer’s fidelity. This a problem that plagues many digital mixers. To be fair, it is not so much a problem with the mixer as it is with how the mixer is used. For some consoles, it is a bad practice to route a given channel directly to the main bus and then also to the main bus by a different route. The latter is sometimes done as a means of adding effects, but any timing differences caused by the longer path can cause severe tonal coloration by producing a comb filter when the signals are mixed.
A similar problem can occur with digital mixers that utilize remote stageboxes. In many cases the stagebox input will have more latency than the mixer’s onboard IO. For example, if I put two microphones on a sound source, with one connected to the stagebox and the other to the mixer’s onboard input, and then mix those two signals together, the timing difference can cause a comb filter. Again, this is not so much a mixer problem as it is a user problem, but people are going to do it so we need to be aware of any ramifications.
Some mixers are compensated by design to avoid these path length differences. Others are not. We included two analog mixers in the lineup to demonstrate the absence of latency. One is the APB Dynasonics H1020. Can you find the other one?
The Timing plot shows the impulse response of the mixer using the paths shown at lower right. The arrow symbol shows the path, and the summation symbol shows what is being mixed (the paths on the left and right of the symbol)(Figure 4).
Figure 4 – Legend for routing and mixing
Any timing differences are shown in the time domain (the Timing tab). A perfect device would pass all of the signals with the same latency.
The impulse response also reveals the polarity of the mixer. A positive-going impulse means the mixer preserves the polarity of the applied signal. A negative-going impulse means that the signal is inverted by passing through the mixer (Figure 5).
Figure 5 – Polarity can be determined from the impulse response.
Summing Tab
If a timing difference exists between two signal paths, a comb filter will be produced if the longer path signal is mixed back with the original. The Summing tab shows the frequency response magnitude of the summed signals. The effect on the mixer’s frequency response can be dramatic.
The obvious solution is to never route signals to an output bus through multiple paths. If you must, buy an analog mixer or one that has internal compensation for the path length difference.
Conclusion
On one hand this study reveals that the mixer is not likely to be the weakest link regarding sound quality for any sound system. All of the mixers flawlessly cover the audible spectrum with a dynamic range that far exceeds that of vinyl (65 dB) and in many cases that of the CD (96 dB).
On the other hand, from this study one can clearly see that all mixers are not created equal. Differences, even if subtle, always exist. There are significant challenges to producing a system response with 100 dB of dynamic range (approximately CD-quality). This requires that the gain structure of each component be fully optimized. EMI mitigation may be required on some inputs and outputs. And this doesn’t even factor in the weakest links – the microphones, loudspeakers, and room.
Audio is indeed a challenging field and the future is bright for those who can achieve good sound in the Zoom™ meeting era. If you would like to learn more about the concepts presented in this video, check out SynAudCon’s online training Course 100 (Principles of Audio) and Course 200 (Signal Chain Optimization). pb
