A Contrast of Statistical and Geometric Room Acoustic Analysis
by Pat Brown
Statistical and geometric room acoustics analysis have been with us for well over a century. Computer modeling makes geometric acoustic analysis (GA) practical at the drawing board. This article contrasts the two methods.
The room impulse responses (RIR) from Room Survey 38 – Ministry of Foreign Affairs (MFA) provide an opportunity for discussing the significance of early-reflections in a room. Their consideration allows us to contrast the major approaches to room acoustics predictions – statistical vs. geometric.
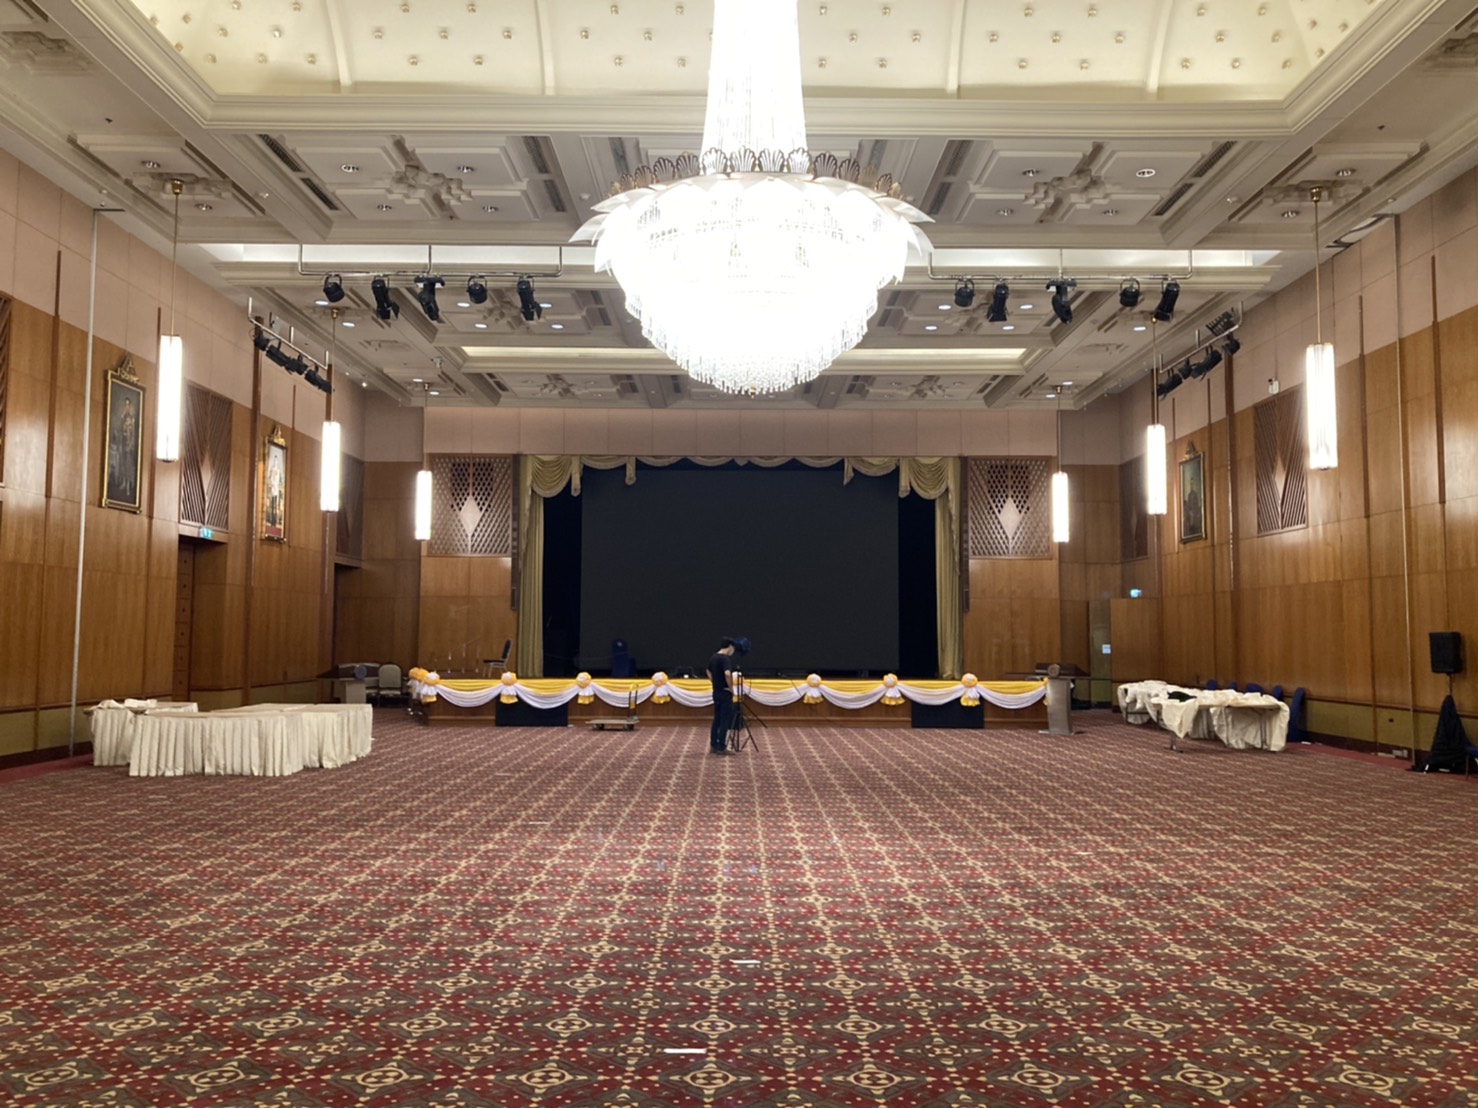
The Ministry of Foreign Affairs – Bangkok, TH
Statistical Acoustics
The statistical method of room acoustics analysis involves the use of reverberation time (RT) equations. These include the Sabine equation, Eyring equation, and others. These equations calculate the reverberation time of the room based on its volume and internal absorption (Fig. 1). While the mental model of sound propagation is that of waves, reverberation is a diffuse field that develops after more than a second of decay and after a great deal of room reflections have occurred. After the introduction of an impulse of sound energy into the space, the reflection-density at the listener increases with passing time and a diffuse field develops. This assumes that the room meets certain criteria, namely that it has a “mixing” geometry, low absorption, and no concentrated absorption. A “big concrete shoebox” serves as a theoretical example.
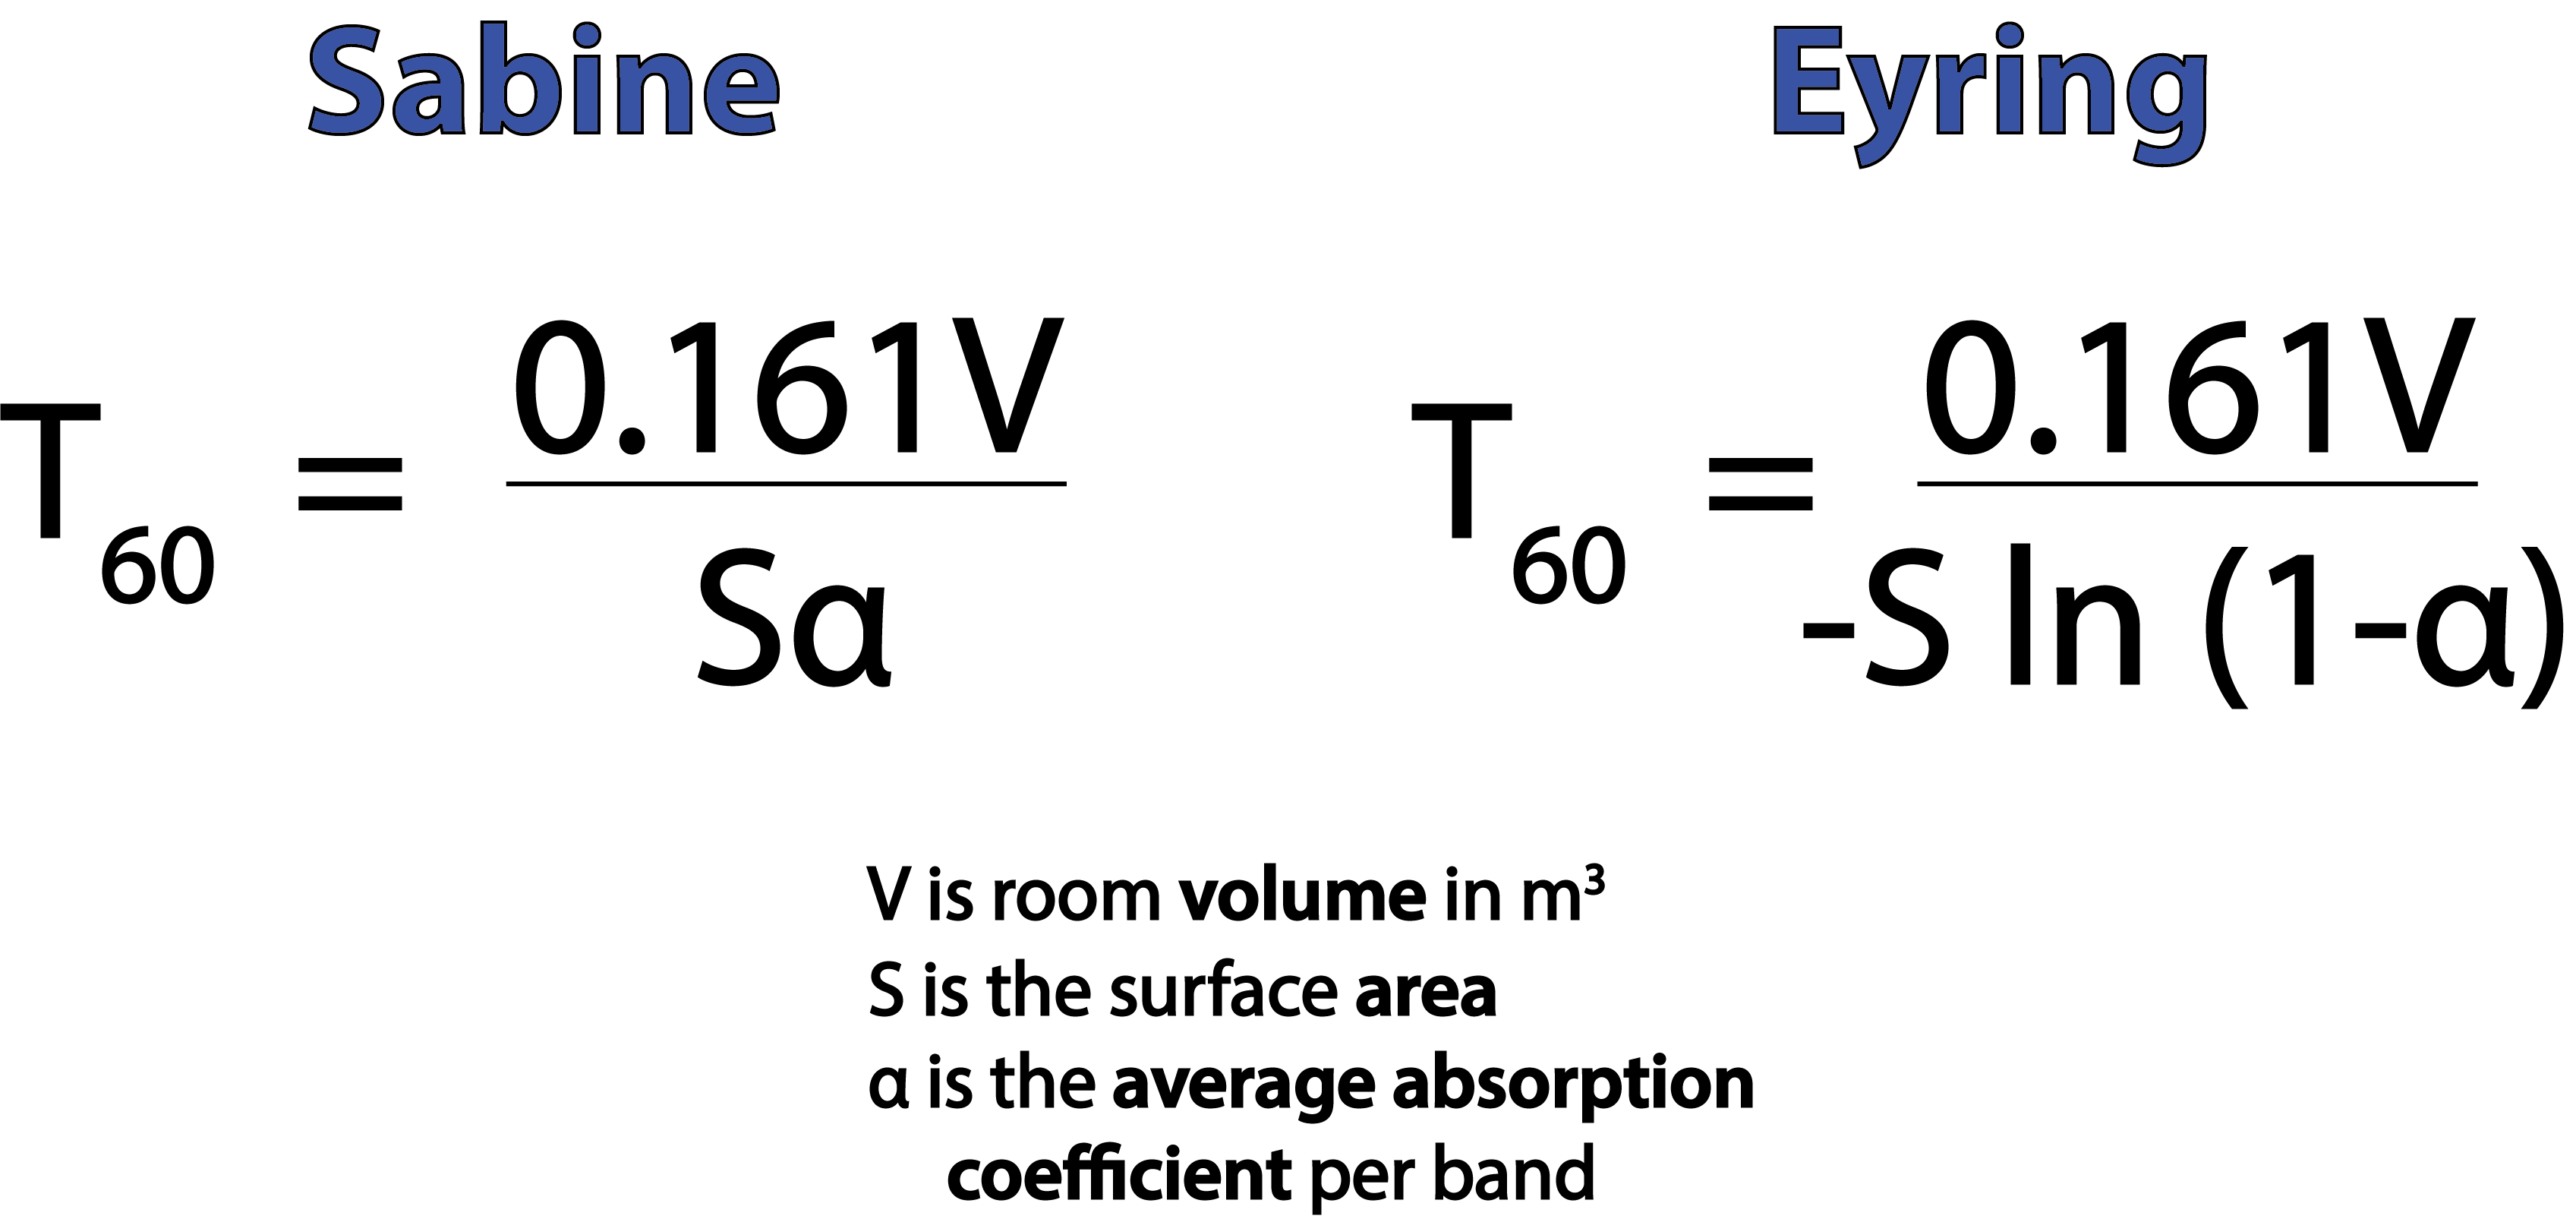
Figure 1 – Statistical reverberation time equations are the simplest approach to room acoustics analysis. Their accuracy is conditional, and the effects of air absorption are not shown.
Unlike sound waves, textbook reverberation has no specific direction of energy flow, behaving more like an “acoustic fog” than a propagating wave. If an impulse is emitted in the space, this highly ordered compact event succumbs to the 2nd Law of Thermodynamics, and any order (or information) that it contains is eroded away over time. This increase in disorder is called entropy and there is no escaping it with physical systems. Nature insists that information runs out of, not into, a closed system over time. The sound energy eventually becomes diffuse with no net direction of energy flow. An impulsive sound played into a room eventually becomes reverberation (Fig. 2). A common RT measurement technique is to interrupt a steady sound source and time the decay (Fig. 3).
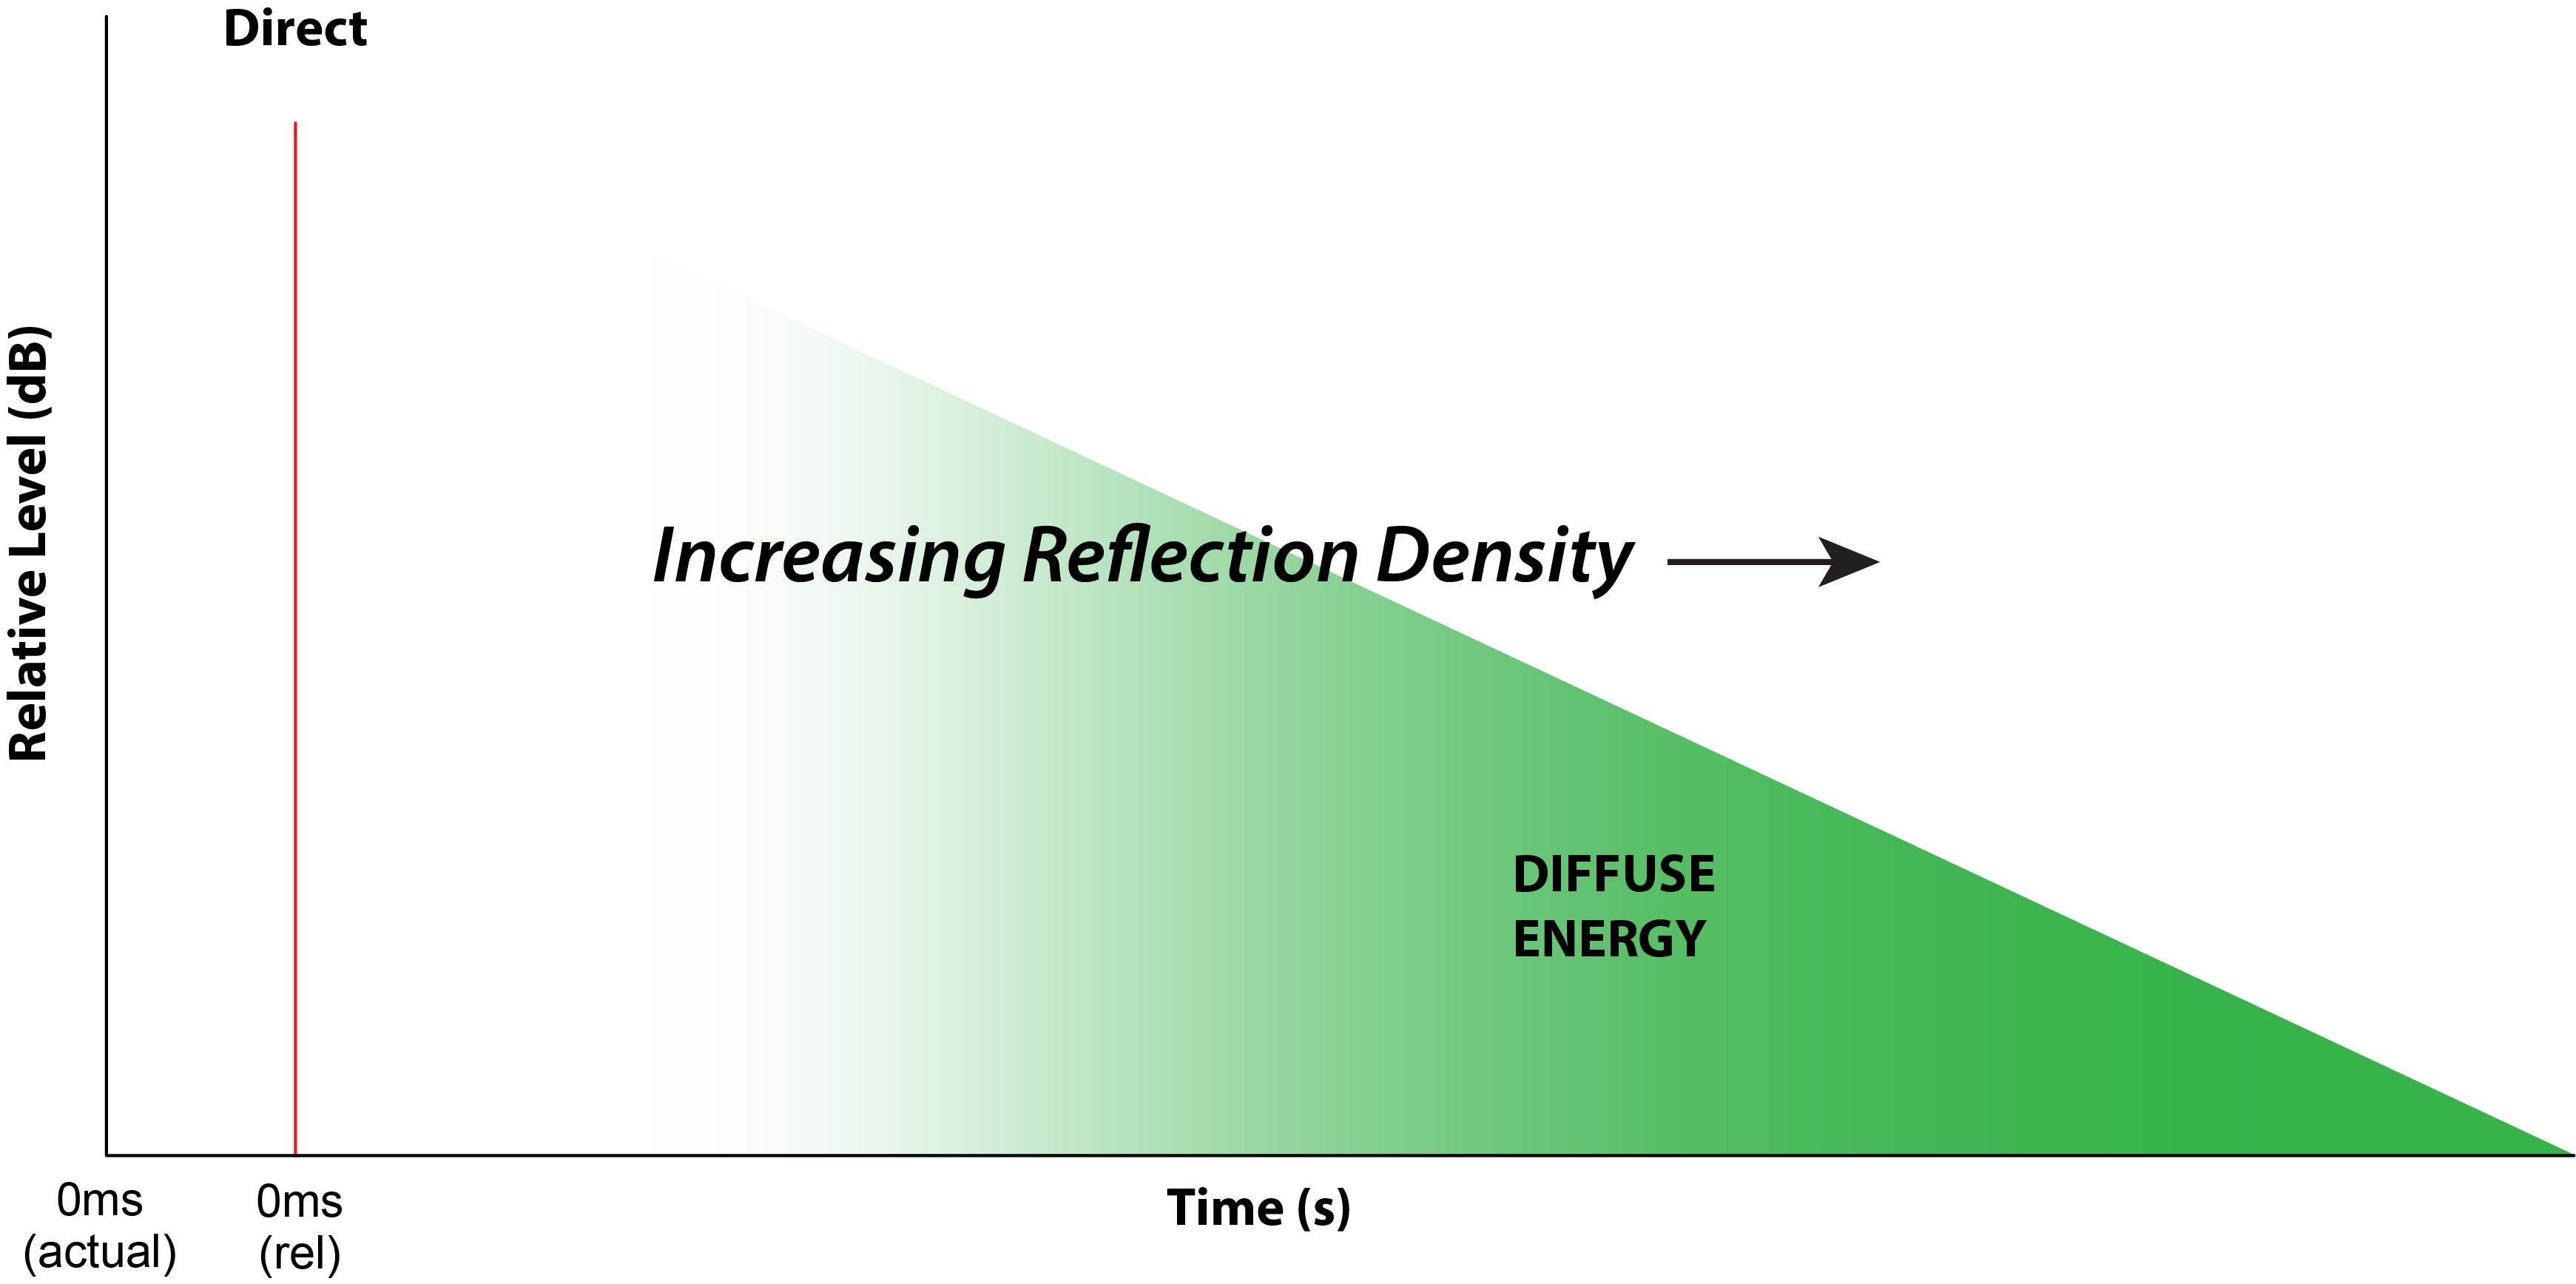
Figure 2 – The introduction of an impulse of sound energy into a space produces room reflections that increase in density over time as the sound level decreases.
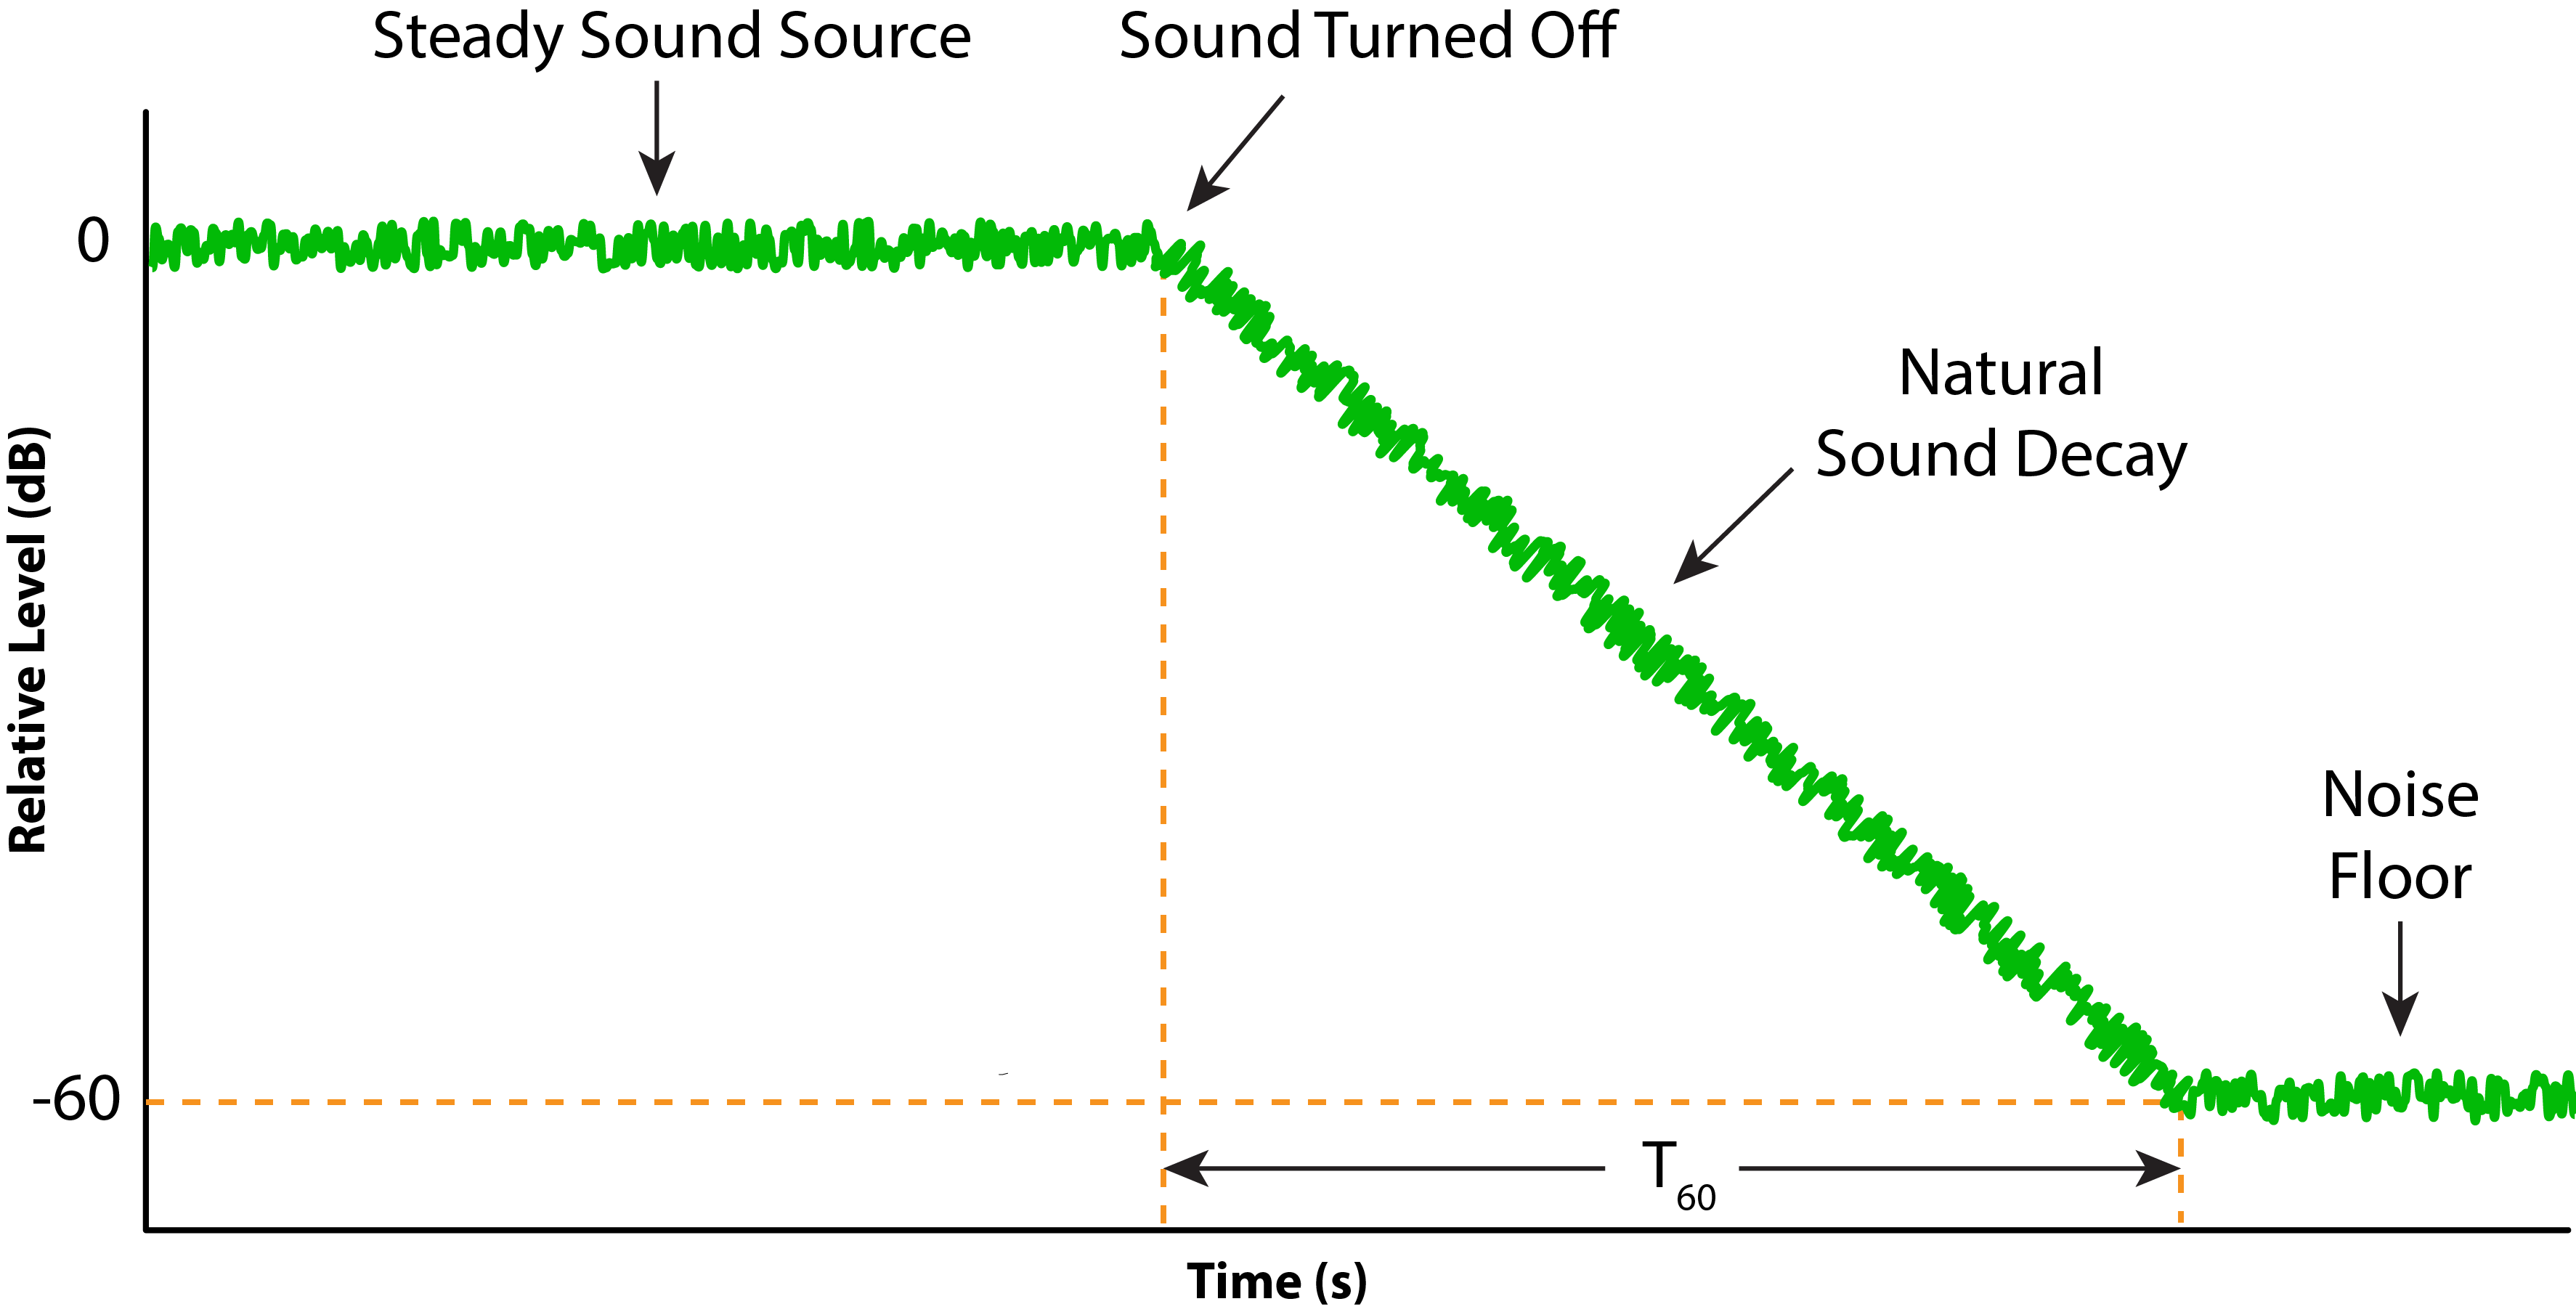
Figure 3 – One method of RT testing interrupts a steady noise source and times the room decay.
Statistical reverberation equations calculate the RT for 60 dB of decay of this diffuse field. With knowledge of the RT, the direct sound level (LD) and the reverberant sound level (LR) can be calculated using the Hopkins-Stryker equation. Once LD and LR are known, the speech intelligibility (SI) can be estimated using the Percentage Articulation Loss of Consonants (%ALCONS) as formulated by V.M.A. Peutz late last century. The %ALCONS score can be converted to the more contemporary Speech Transmission Index (STI) for comparison purposes. It is important to note that this is technically not a direct conversion, since STI includes many factors ignored by %ALCONS. Even so, the results of the two methods should be in general agreement. I developed a soon-to-be released calculator for use in SynAudCon online training programs that allows the interaction of these variables to be visualized (Fig. 4).
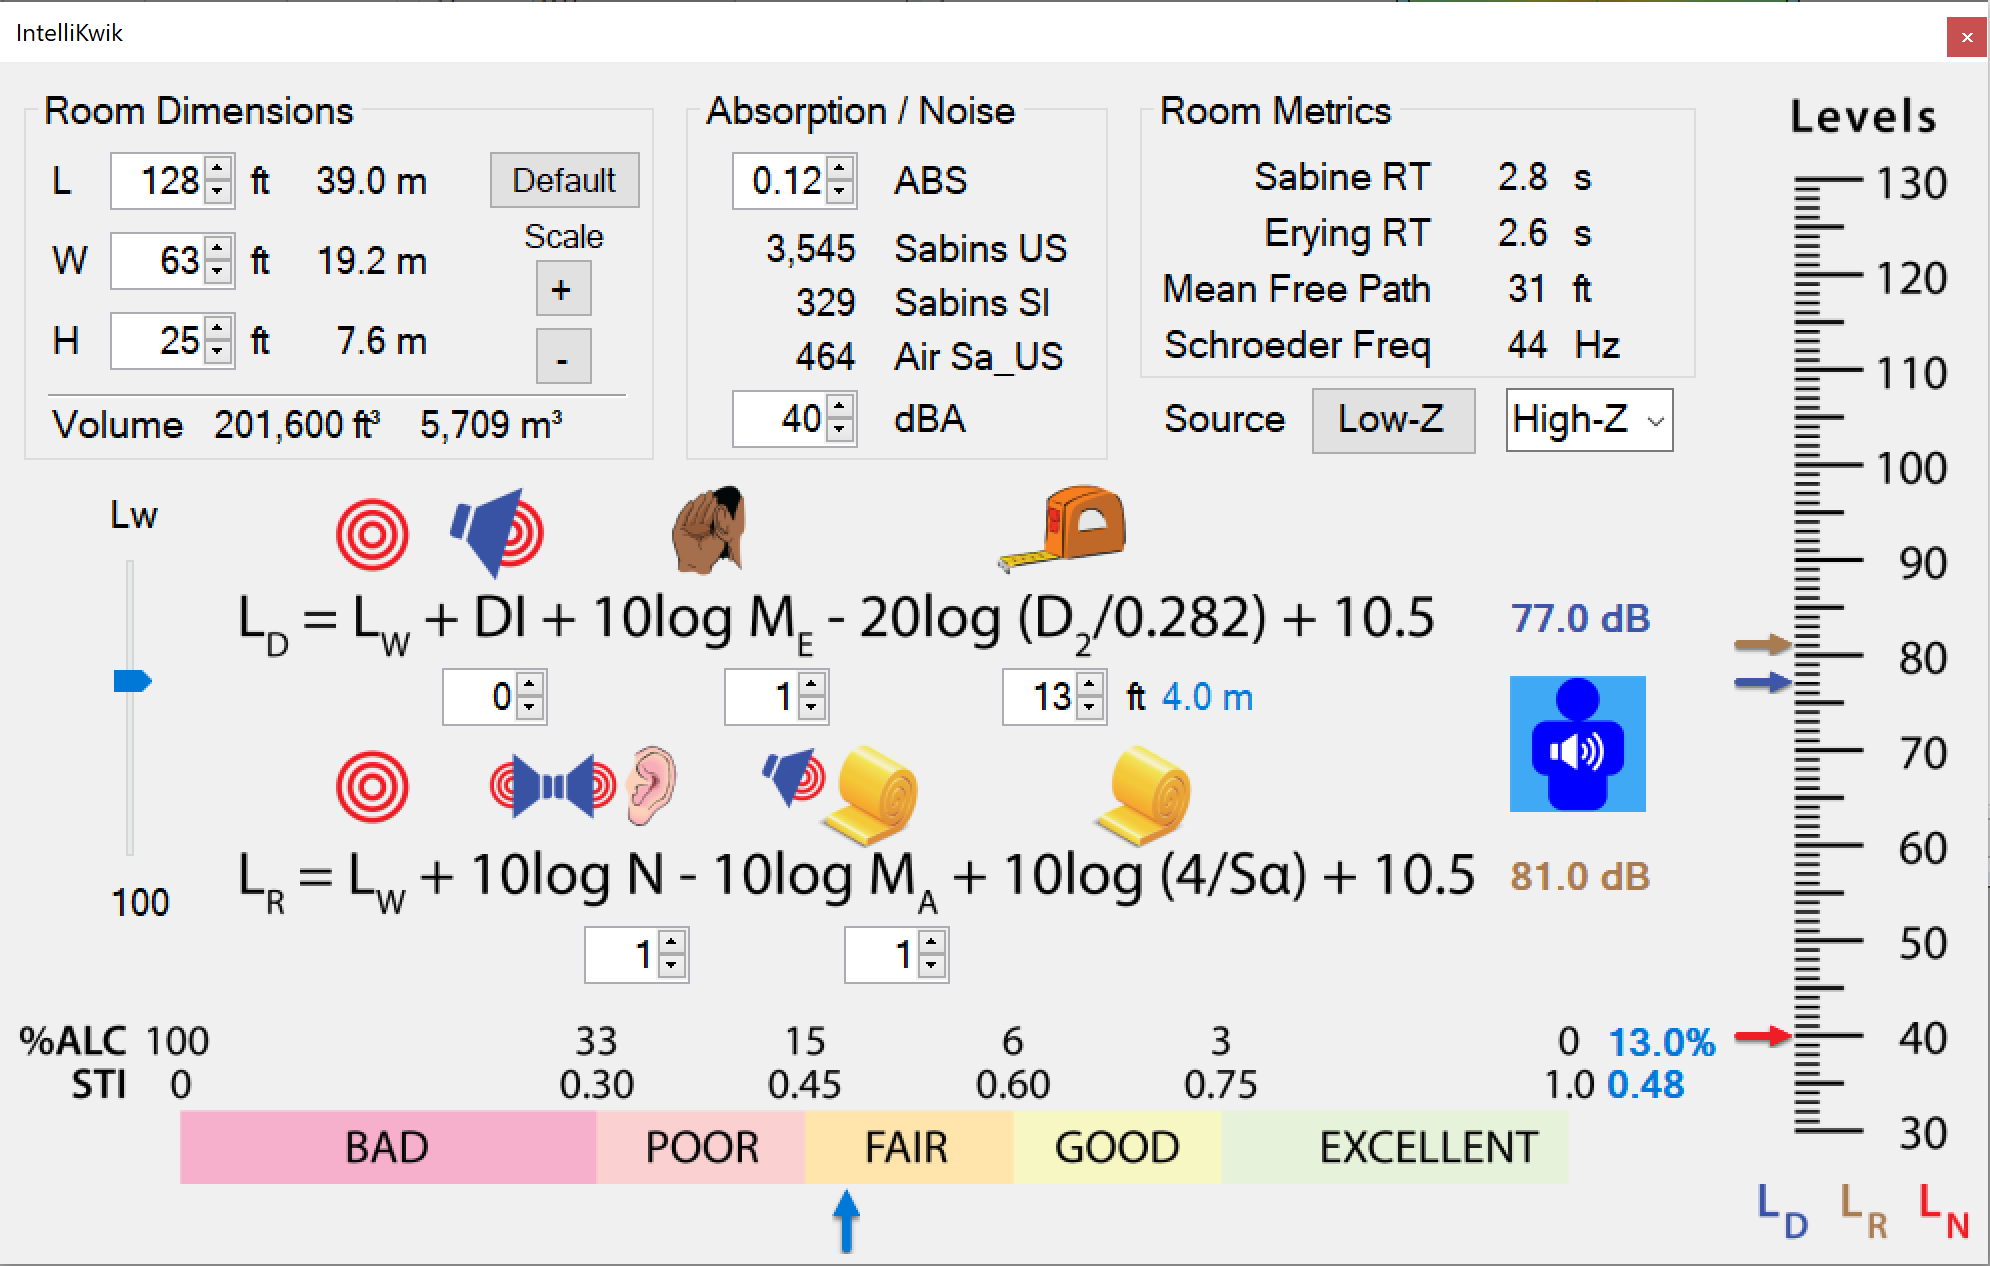
Figure 4 – IntelliKwik™ allows for fast estimations of the potential speech intelligibility using statistical reverberation time formulas, the Hopkins-Stryker equation, and some basic sound system parameters. It can be used to “run the numbers” before building a room model. The settings shown are for Test Position 2 (4 m) of the MFA.
The value of these Hopkins-Stryker relationships cannot be overstated. They form the foundation for the statistical acoustical analysis of an enclosed space.
With statistical acoustic formulas we have a simple-to-implement approach for diffuse field analysis that is blind to the specular-reflected sound energy in the space. In some spaces this “missing” information is insignificant. In others it is the most significant with regard to the sound of the space, and therefore the SI.
The Missing Details
It is important to consider what we cannot know from the statistical approach to room acoustics analysis. As entropy morphs the LD into reverberation, the sound waves undergo a series of reflections in the space (Fig. 5). As the impulse reflects from each surface some organization is lost, but incrementally. Low order reflections can still retain a significant amount of organization. If the sound were a speech waveform (which by definition carries information), these reflected facsimiles of the original will also contain information. Whether or not this information is useful to the listener depends on their arrival time relative to the direct sound field LD. At a specific listener position, these “specular” reflections are categorized as “early” or “late” with 50 ms serving as a general dividing time for speech. Early reflections are often useful for communication (or at least are non-harmful) and late reflections are generally a detriment to communication. Considering the effects of specular reflections requires a different tool set than the simple statistical equations used to compute reverberation times.
Geometric Acoustics
Geometric Acoustics (GA) uses optical principles to model specular reflection behavior. It can be used to fill in the missing events in the RIR. While statistical reverberation equations are most valid in rooms with low absorption that is uniformly distributed, GA has no such limitation. Since most rooms aren’t dominated by a statistical reverberant field, GA becomes a primary design tool.
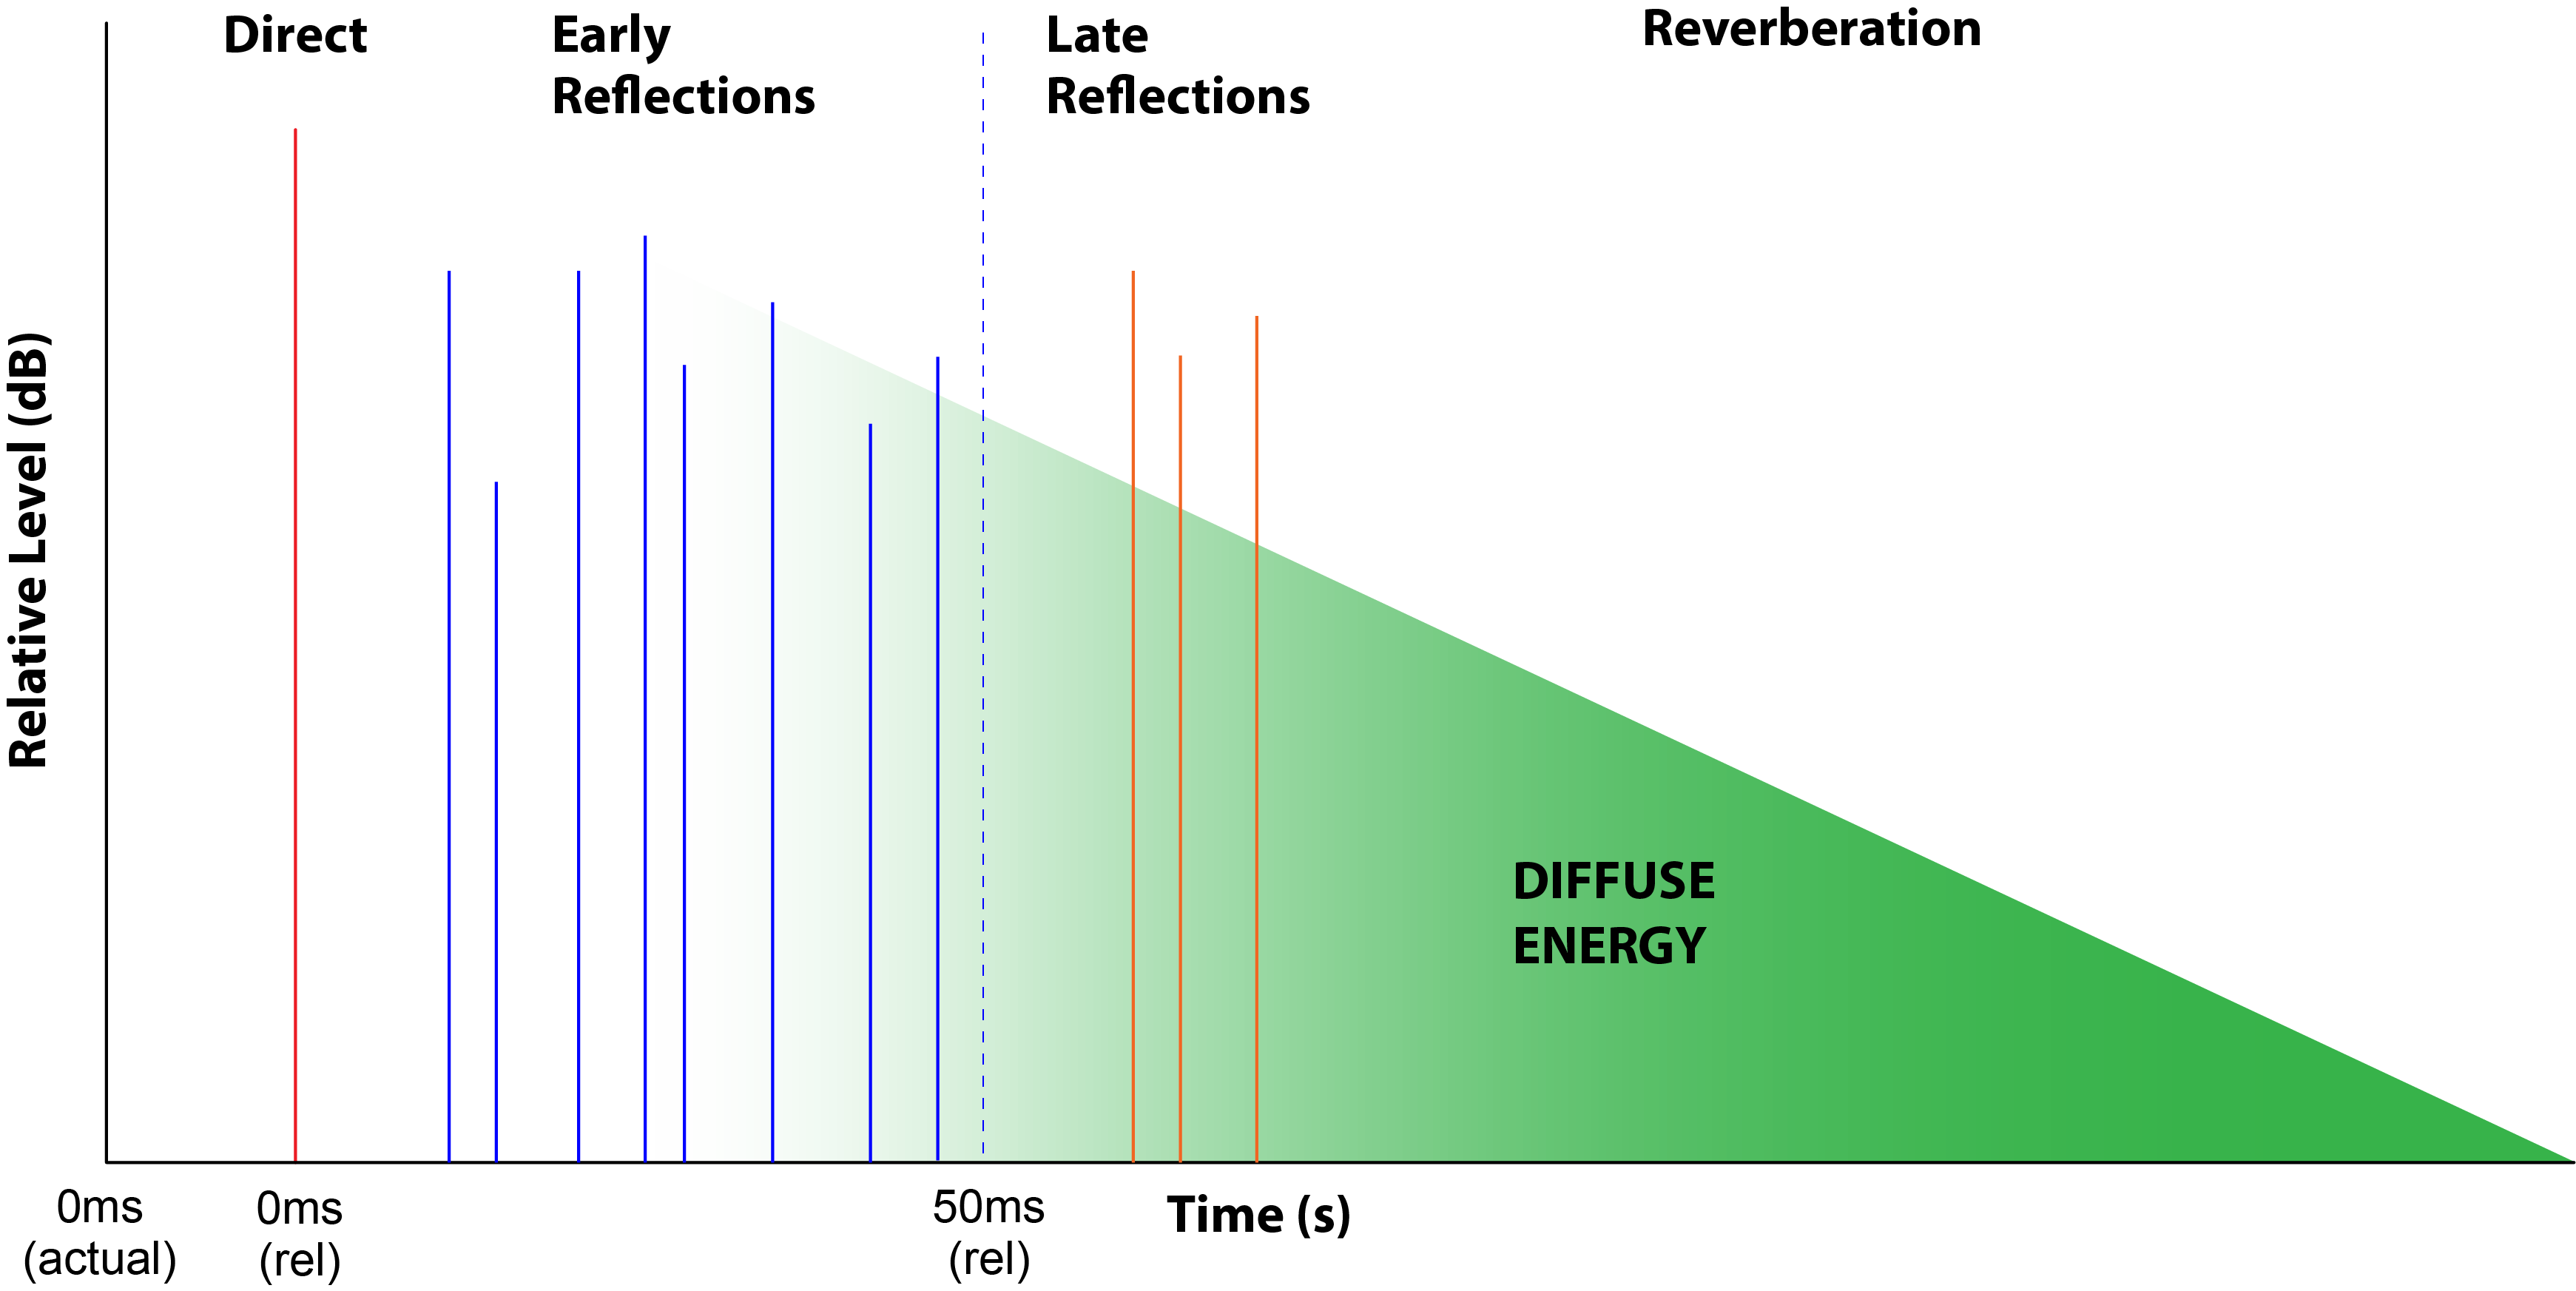
Figure 5 – The RIR includes both specular reflections and diffuse decay.
A Real-World Shoebox Example
Now, back to our reference case of the Ministry of Foreign Affairs. This room is basically a “shoebox” with absorptive floor and ceiling and hard side walls. We would have every reason to expect the presence of significant specular reflections within the space, especially given the source and receiver positions used for the RIR measurements (Fig. 6).
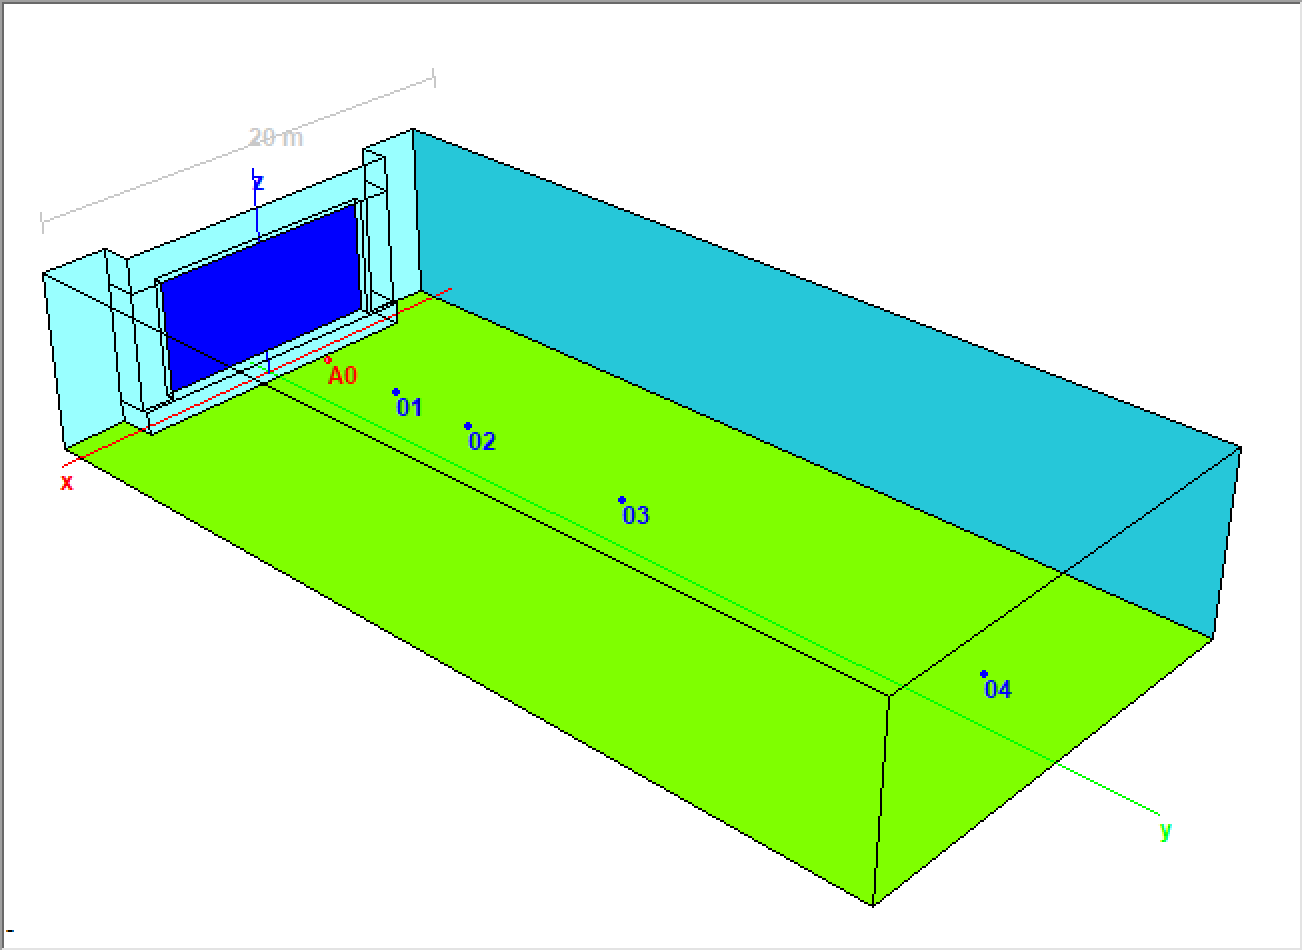
Figure 6 – A simple model based on the room dimensions and source/receiver positions in the MFA (CATT-A). A0 is the omni sound source and 01, 02, 03, and 04 are receiver (listener) positions.
The Statistical Approach
I first used IntelliKwik to determine LD, LR, and the resultant SI. I caught a massive break here in that the room volume and RT were already known from physical measurements and the RIRs. This allowed me to “seed” the calculator with valid data, with a potentially dramatic improvement in the accuracy of the results. The STI values calculated for each position have been added to the results matrix from Room Survey 38 (Fig. 7). Note that the STI degrades with increasing distance for the calculated values, as it must. Statistical equations know nothing of specular room reflections that can add useful, early energy for specific listeners. As a result, the statistically-predicted STI yields an error that increases with distance from the source.
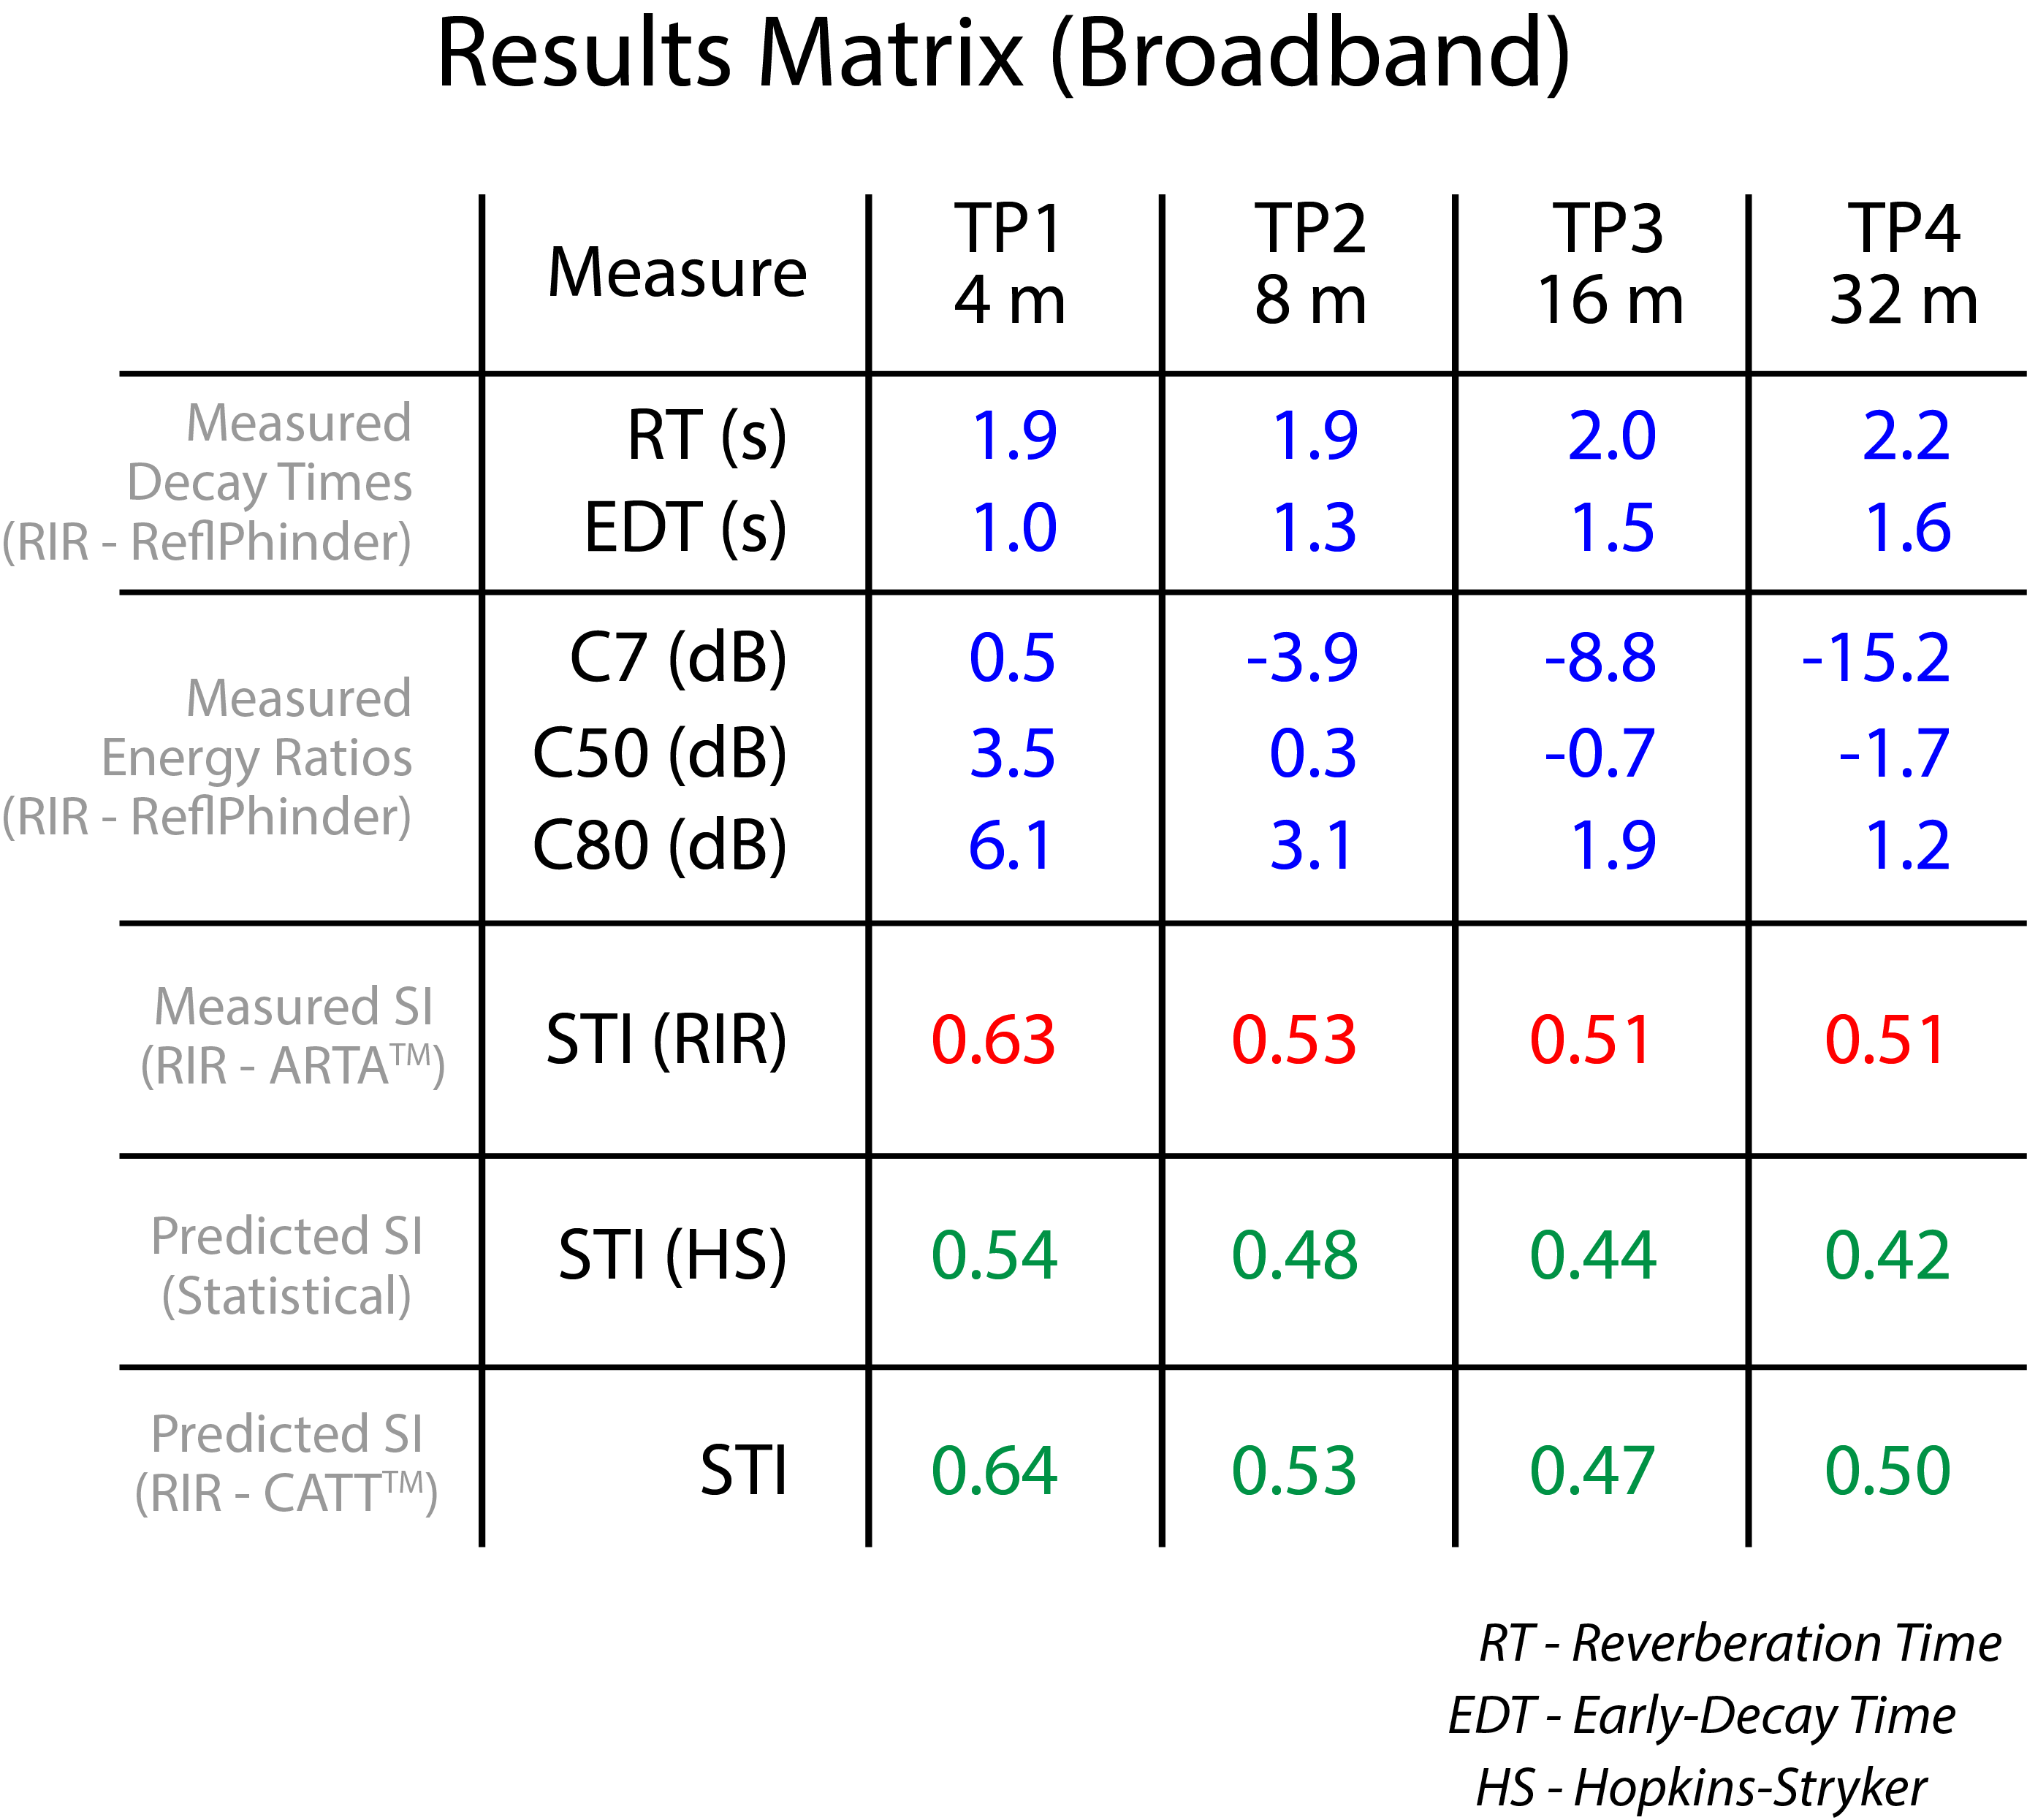
Figure 7 – The results matrix from Room Survey 38 with additional entries for STI calculations based on statistical equations (IntelliKwik) and GA (CATT-A).
We got an answer quick, but the STI was underestimated. Since the error increases with distance we have a strong clue that there is more at play than LD and LR. We only know this because we have measured RIRs to provide a benchmark. If our analytical tool only considers LD and LR (e.g. IntelliKwik) then we will only see the influence of LD and LR and may think that we have the whole story and therefore underestimate the STI.
But, at the drawing board it is better to underestimate the STI than overestimate it, and the statistical-only approach has value. It is fast, conservative, and it makes us work a bit harder on our design with regard to loudspeaker selection and placement. I have never had regrets that a system performed better than expected.
Then why do we need GA? The need will become apparent once we run through the process.
The GA Approach
I punched out a quick shoebox in Sketchup™ in accordance with the physical room dimensions. I assigned some colors to the planes to identify them for absorption data that would be added later in the room modeling program. This simple model was exported to CATT-Acoustic™ using SU2CATT™ and the colors were assigned appropriate absorption alphas. I used measured RTs mined from the Test Position 4 RIR to aid in assigning absorption alphas and scattering to the room surfaces (Fig. 8).
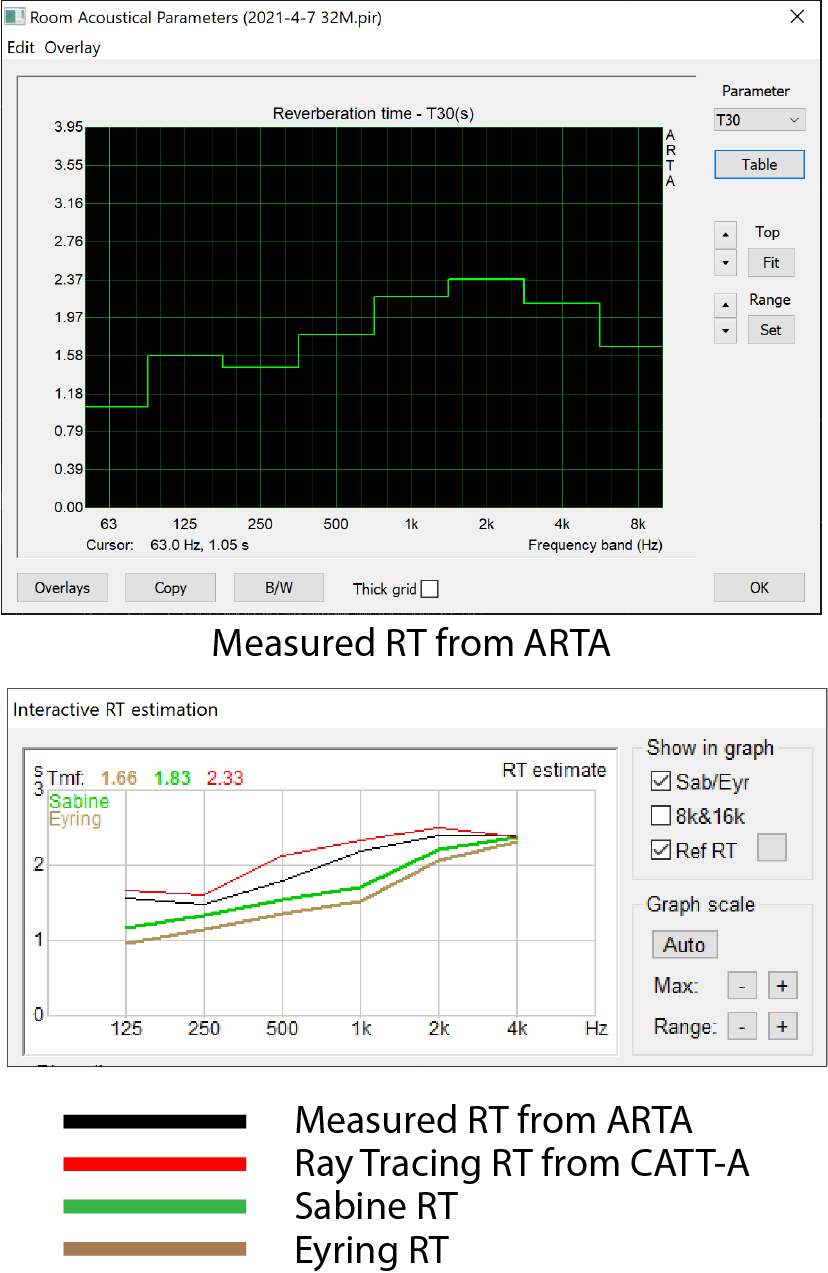
Figure 8 – The measured RTs provided invaluable information for refining the room model. Note that both Sabine and Eyring underestimate the RT. This is due to non-uniform distribution of a significant amount of absorption in the space. CATT-A provides a quick ray tracing routine in its Interactive RT Estimation module for comparison with Sabine and Eyring. In a truly statistical space all four of these RT measures should be in good agreement. When they are not (as in this case) it is best to proceed with a GA-driven design approach. A conservative practice is to make the predicted RT slightly longer than the measured RT. In other words, slightly underestimate the room absorption. The black curve is the “Ref RT” from the measured RIR.
A Logical Modeling Process
Since the RT is known, and the side walls are obviously reflective, it was not difficult to tweak the floor and ceiling alphas to match the measured RT after applying a very low alpha to the walls. Given the geometric complexity and apparent absorptiveness of the ceiling (from the photographs), and the visual appearance of the carpet I felt it safe to assume that the ceiling yields more sabins (higher absorption) than the floor. I selected a moderately absorptive carpet material for the floor, and then tweaked the ceiling alpha to approximate the measured reverb times. Lastly, I used significant scattering on the ceiling to “de-specularize” it to simulate the high surface complexity. This “educated guessing” is a big part of room modeling. My main objective was to consider the side wall contributions to the RIR and with GA modeling I have the freedom to overestimate their influence if I choose to. Modeling allows us to easily isolate the influence of specific surfaces and sound paths – something not easily accomplished with measured data.
The time required for the entire modeling process was maybe 30 minutes, yielding a model with reasonable base-line accuracy that can be further tweaked if necessary. It is important to point out that with the major variables quantified and a good match to the measured RIRs, refining the model further may yield diminishing improvements in the simulation accuracy. I could spend many hours increasing the ceiling detail with nearly no impact on the prediction results. The modeler must weight the significance of adding detail with regard to its effect on the results. A better model for the eye is not necessarily a better model for the ear.
Figure 9 shows a map of the STI produced in CATT-A. Note that the STI is high near the source (A0) and falls with increasing distance from the source. This is in agreement with my IntelliKwik calculations. Note that the STI rises near the rear wall, beyond receiver 04. This is due to specular reflections (e.g. rear wall) and will be missed entirely by a statistical-only approach.
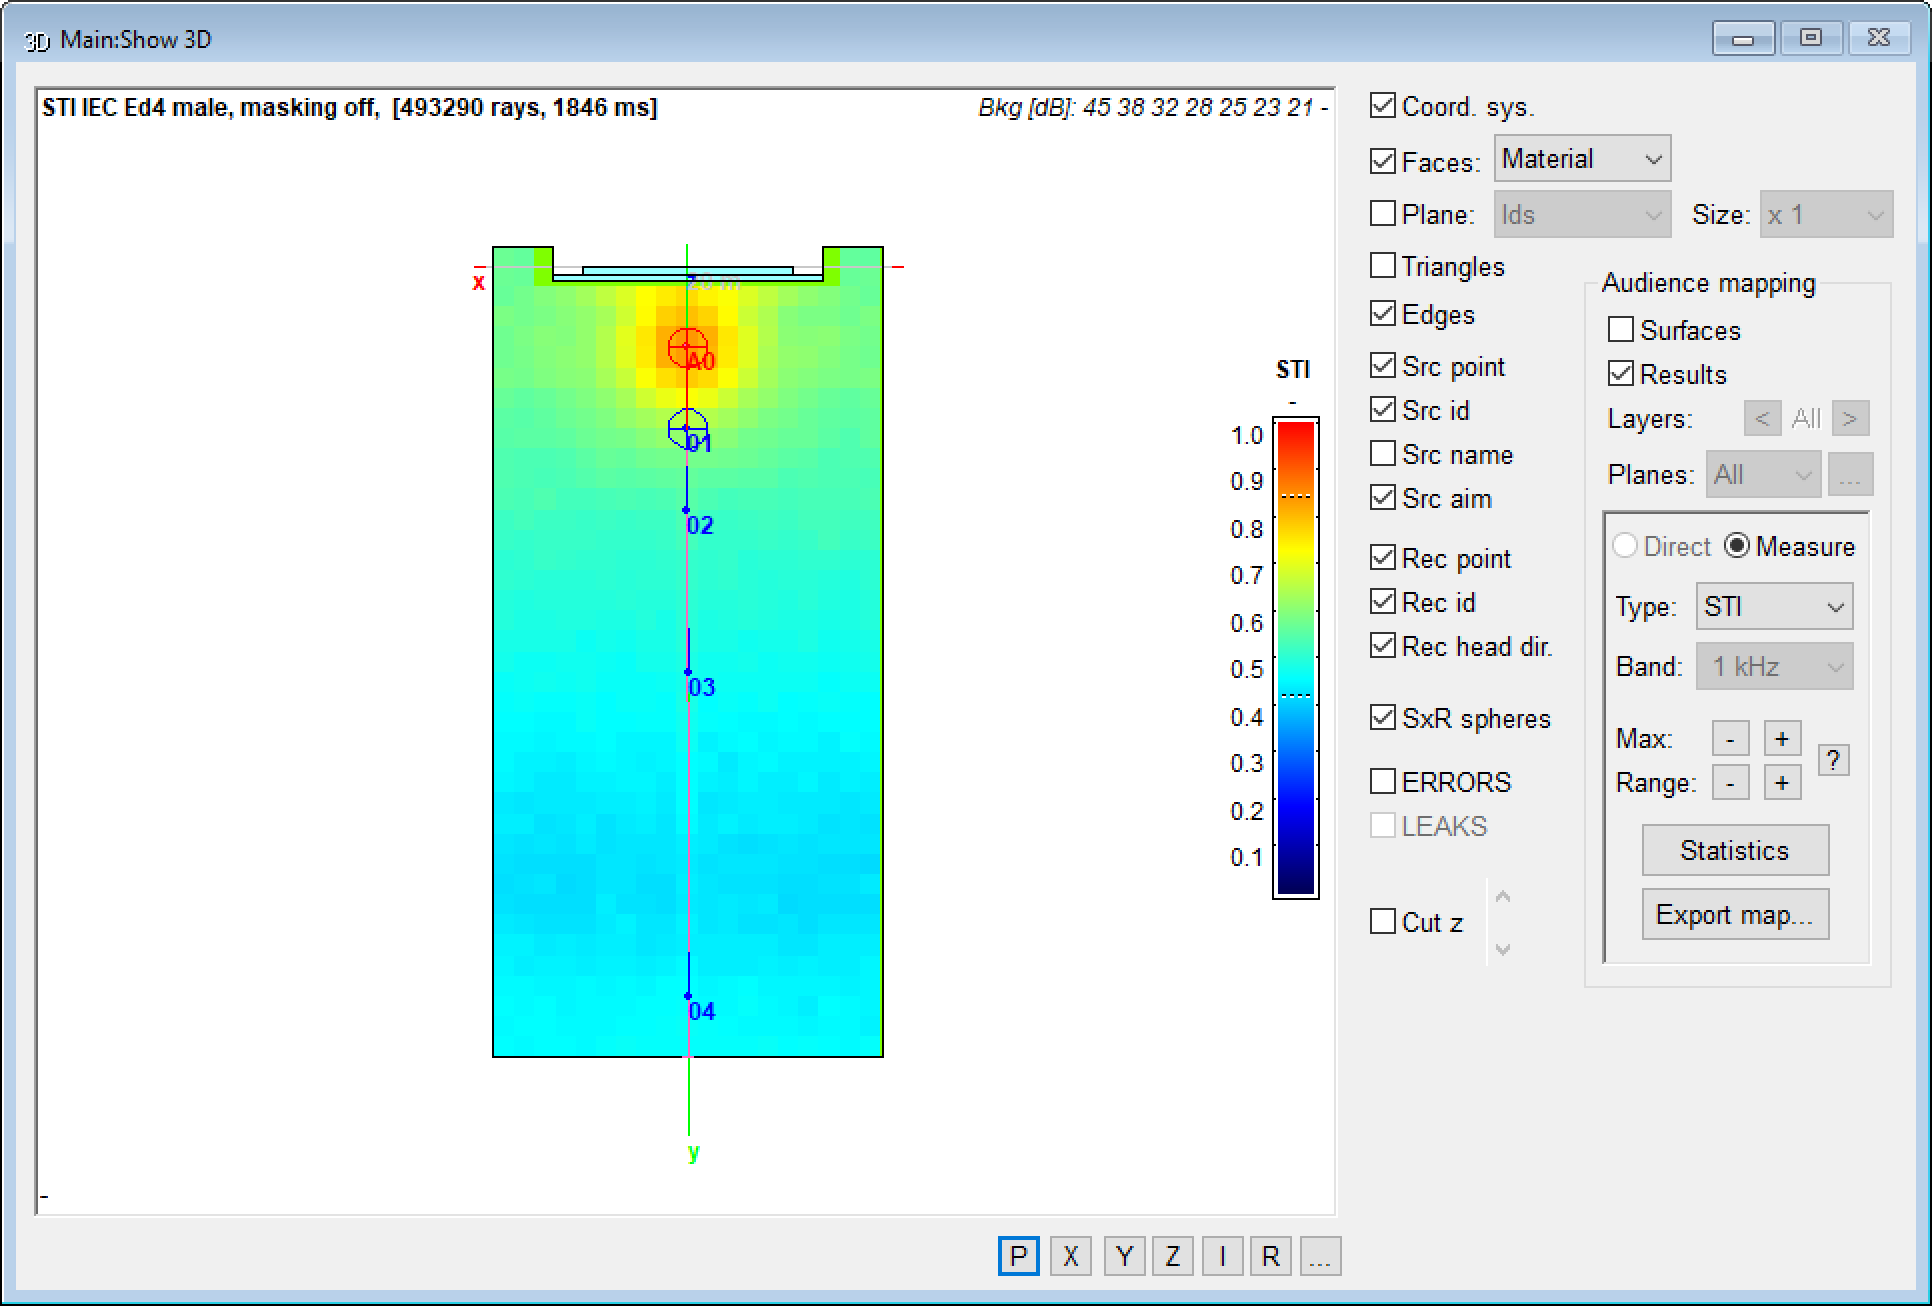
Figure 9 – An STI map of the audience plane (courtesy CATT-A).
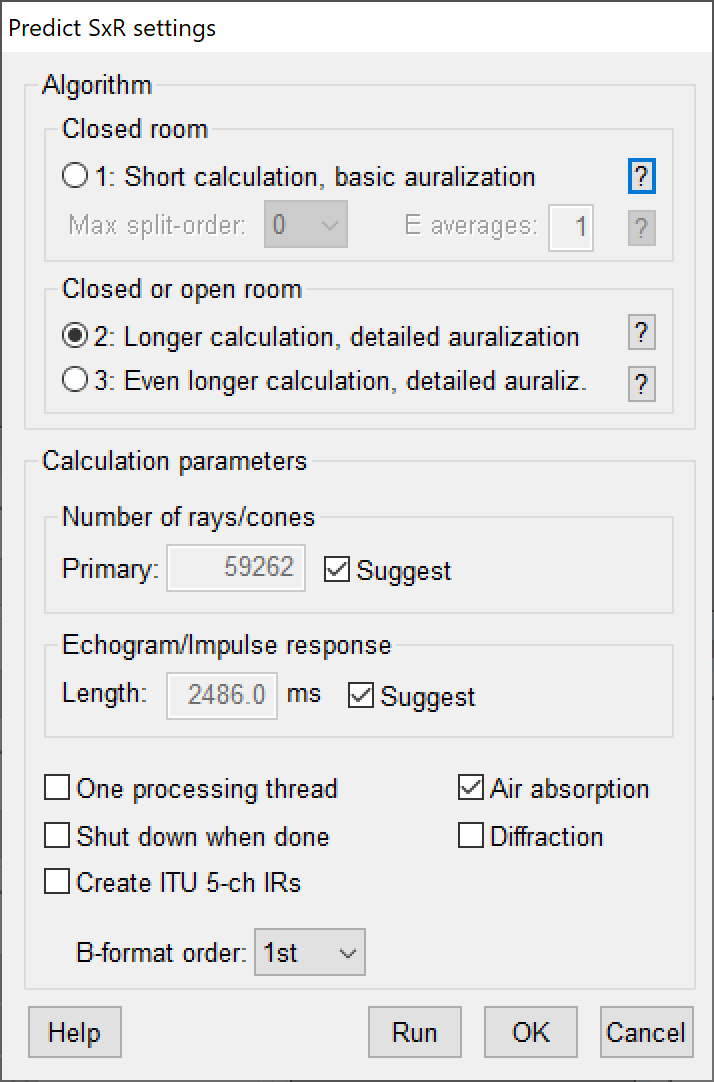 Under-the-hood the use of GA to produce an RIR is staggeringly complex. The details of the process vary from platform-to-platform and go well beyond the scope of this article. While the modeler is insulated from the details of the process, they must still understand it well enough to make some basic decisions when staging a simulation, such as choosing the number of rays and assuring that the resultant predicted RIR is as long as the room’s measured decay time (Fig. 10).
Figure 10 (left) – The setup dialog for running a GA simulation in CATT-A. Note that 3 algorithms are provided, each optimized for specific room types, such as a closed cathedral vs. an open stadium.
Figure 11 compares the measured and predicted RIR for Test Position 3. This predicted RIR can be analyzed and convolved in the same way as the measured one.
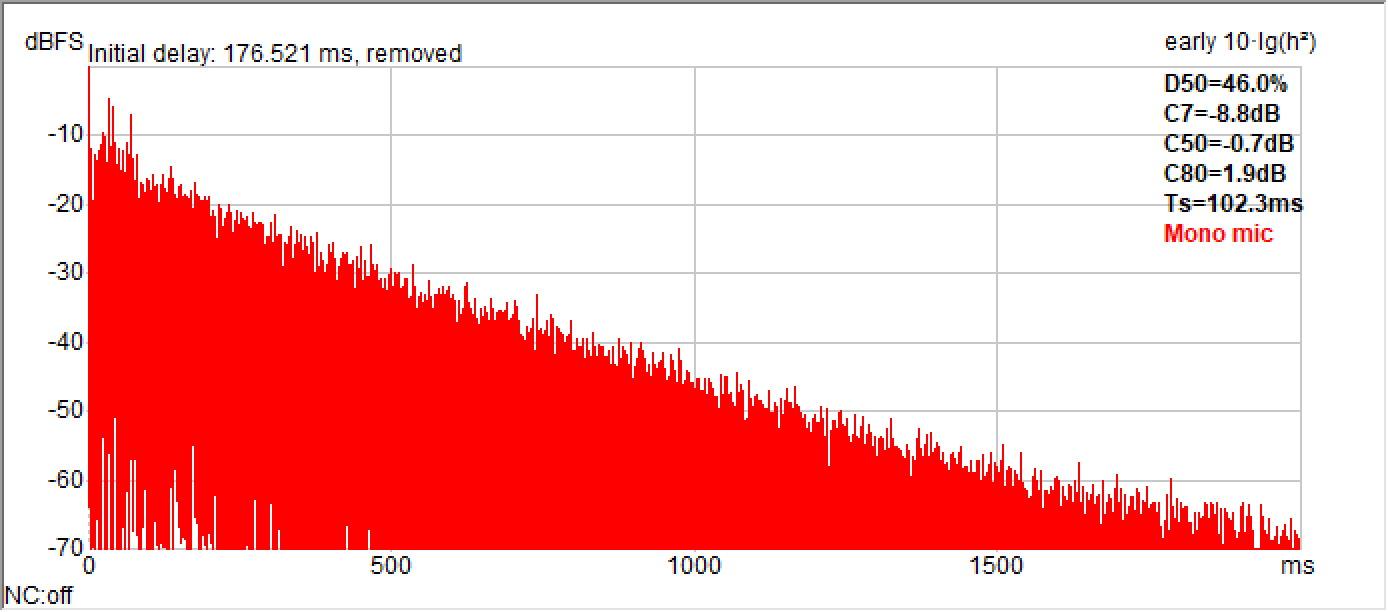
Figure 11a – Measured RIR of Test Position 3. Shown in ReflPhinder™.
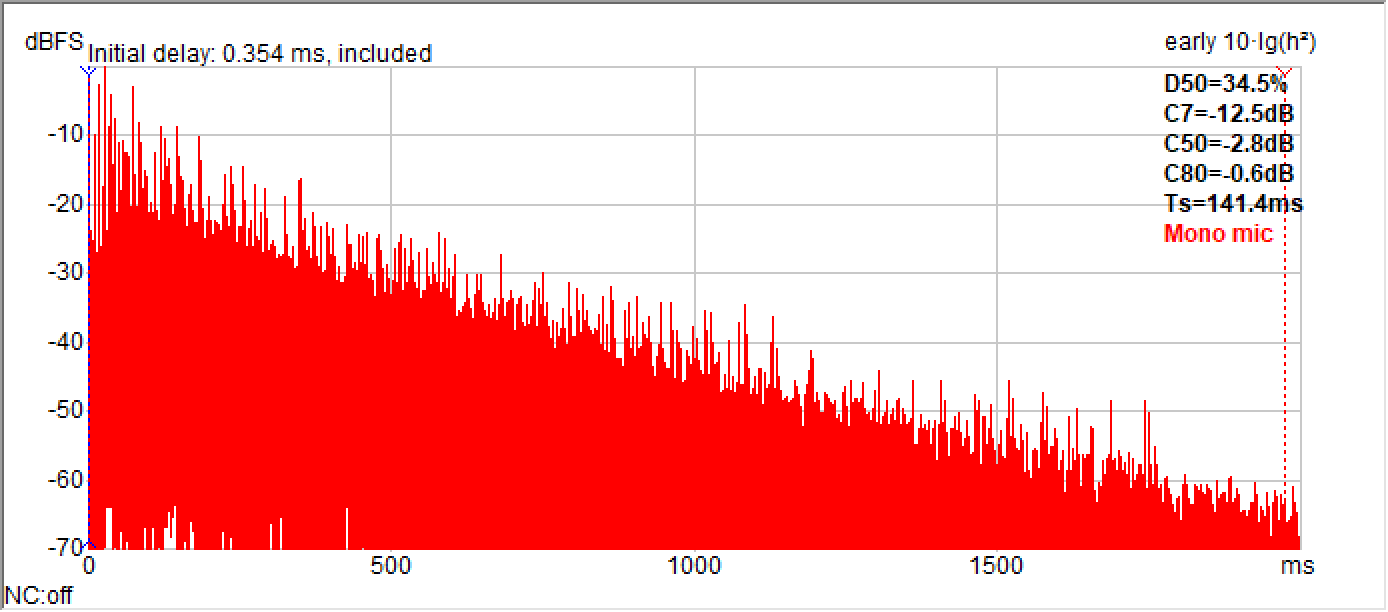
Figure 11b – Predicted RIR of Test Position 3. Since I made the RT of the model slightly longer than the measured, the energy ratios shown here are slightly lower than the measured. The simulation was performed in CATT-A with the results shown in ReflPhinder.
Auralization
A powerful method of results analysis is auralization. Auralization is to a predicted RIR as convolution is to a measured one. Below are auralizations for the four test positions in the study. These can be compared with the convolutions in Room Study 38 for the same positions. You can open it in a second browser window by right-clicking on the link. A special thank you to Tanadej S’prayoon1 for sharing his female talker WAV file.
Observe the results matrix (Fig. 12) as you listen. Convolution and auralization bring the RIR and room measures to life.
Receiver 01 Female Talker
Receiver 02 Female Talker
Receiver 03 Female Talker
Receiver 04 Female Talker
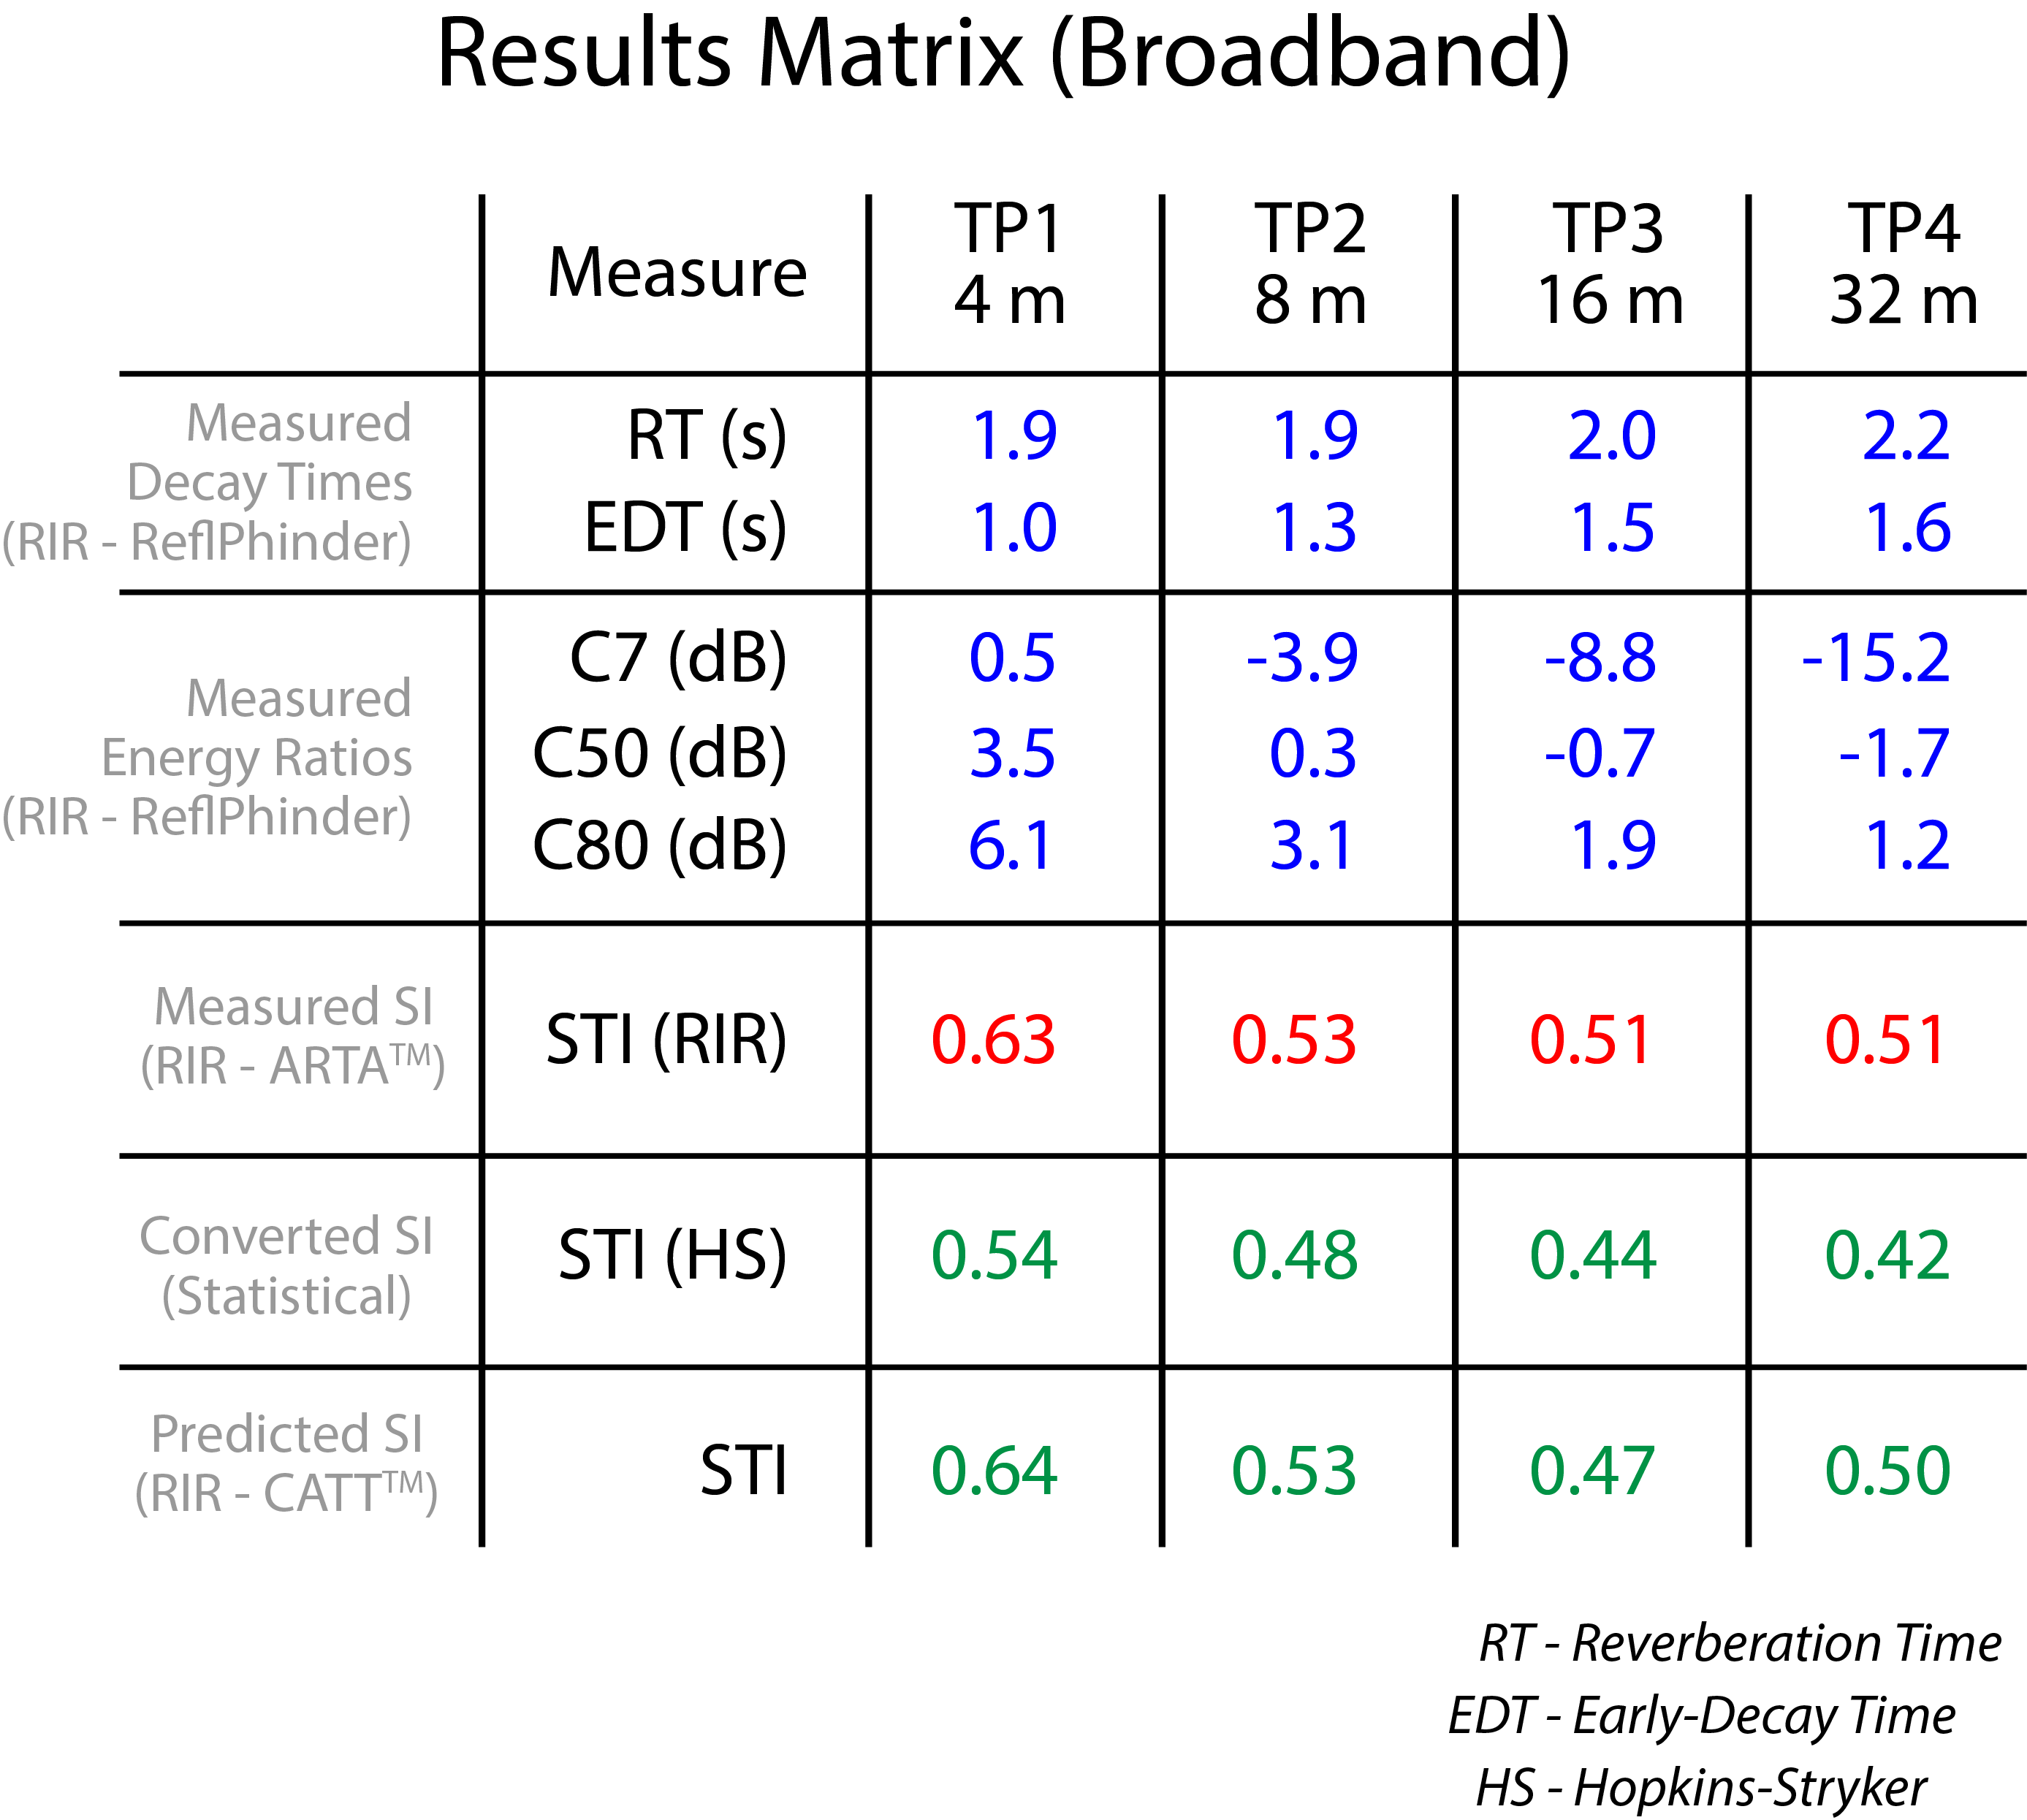
Figure 12 – Results matrix again.
A Coverage Solution
What would be the point of coming this far if we don’t use the model to arrive at a real world coverage solution? The point of RIR measurements with a dodec and the construction of a room model is to establish a qualified virtual space in which to audition our design ideas.
In the model, I placed a medium Q source at the same position as the dodec. This gives us an apples-to-apples comparison of the improvements that can be realized by loudspeaker directivity. Auralizations and the STI are provided below for comparisons with the dodec. Not surprisingly, this placement produces some audible flutter echoes, but the improvement in SI is striking.
Receiver 01 STI = 0.83
Receiver 02 STI = 0.67
Receiver 03 STI = 0.53
Receiver 04 STI = 0.58
With the room model qualified, the system designer is now free to try various coverage approaches, including point sources, line arrays, and overhead distributed. An audience can be added with a slight modification of the model.
Some Observations…
I’ll close with some observations regarding what I have presented.
– The 2nd law of thermodynamics assures that the information runs out of a system over time.
– Room reflections can recycle some of the original information emitted into a space. They do not create new information.
– The diffuse sound energy that results from entropy is reverberation.
– A statistical-only design approach can have reasonable accuracy in rooms dominated by a diffuse field. GA is required for non-statistical spaces.
– %ALCONS is no longer supported by most measurement and prediction programs. It is still useful because it allows the SI to be estimated from LD and LR. It is still referenced in Annex D of NFPA 72 and it can be mathematically converted to the STI (for comparison purposes). The direct computation of the STI requires a completely different approach.
– With an RT > 2 s (2 kHz) this room is a decent candidate for statistical evaluation. In dryer spaces a GA-based design approach becomes more essential due to the stronger influence of specular reflections.
– Log-spaced measurement positions on-axis with a source facilitate the consideration of what should happen to the speech intelligibility with increasing distance from the source. Since the LD drops with distance and LR is essentially constant the SI can only degrade with increasing distance.
-The objective for modeling a space need not be perfect accuracy. In this case I mainly wanted to assess how wall reflections might have a positive impact on SI at seats where a statistical-only analysis suggests a poor result. The GA modeling results were in good agreement with the measured data.
– The RIR, whether measured or predicted, remains the single most powerful room analysis and sound system design tool.
A special thank you to CATT author Bengt-Inge Dalenback for his invaluable comments on the article. pb
1Tanadej Siriwattaprayoon, Protime Business Co., Ltd. Bangkok, Thailand
