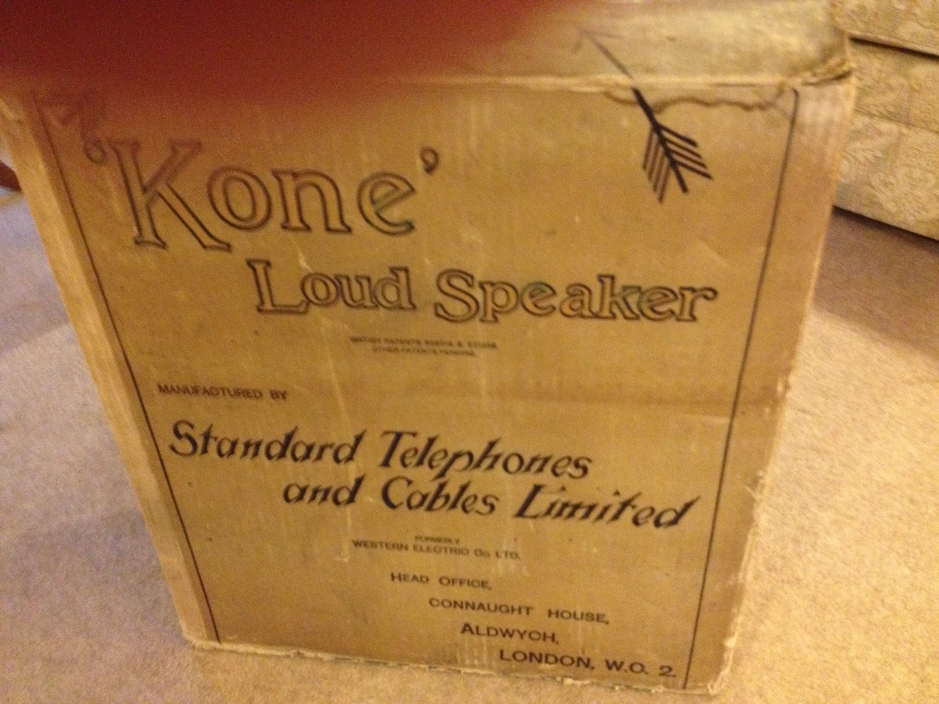
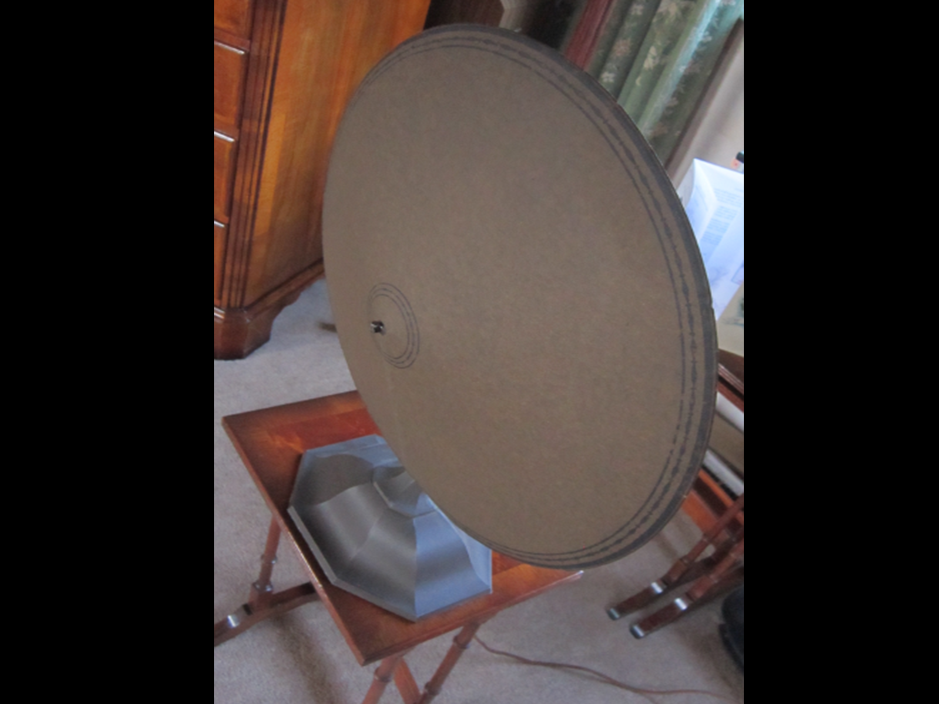
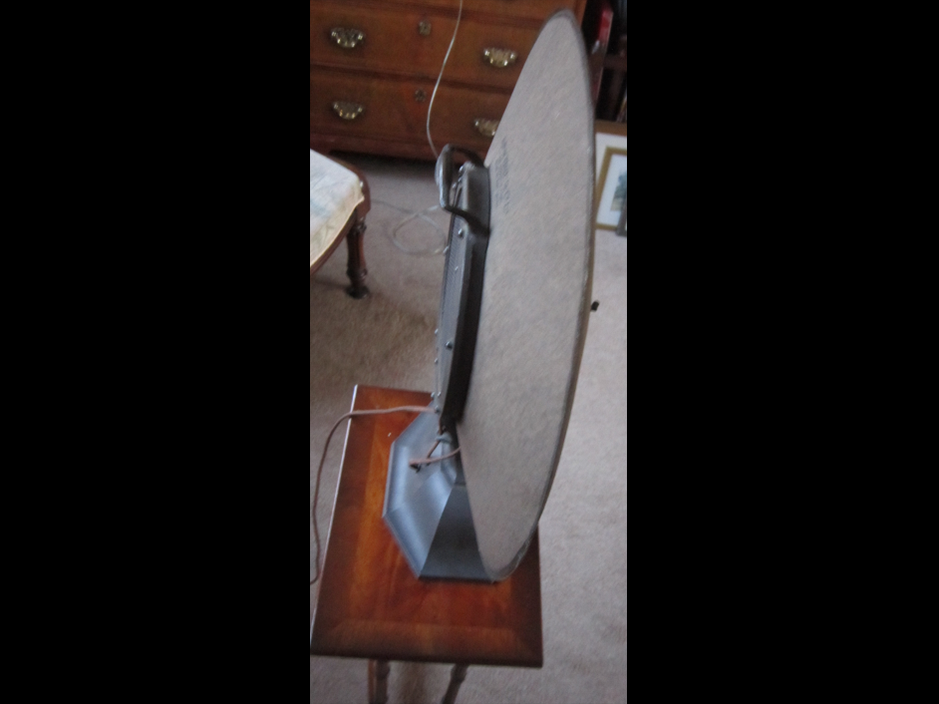
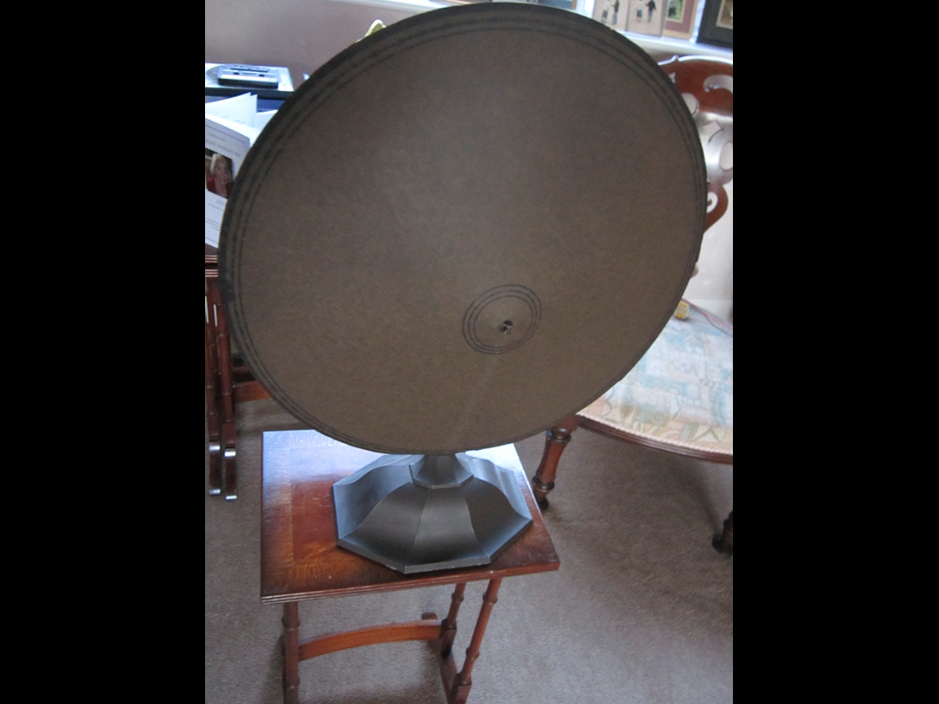
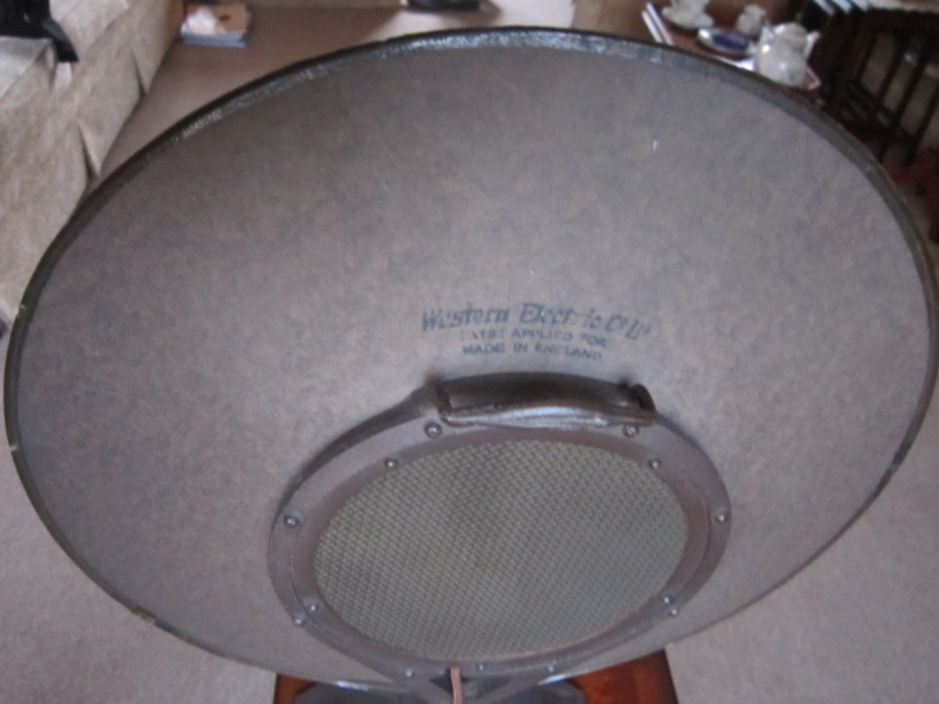
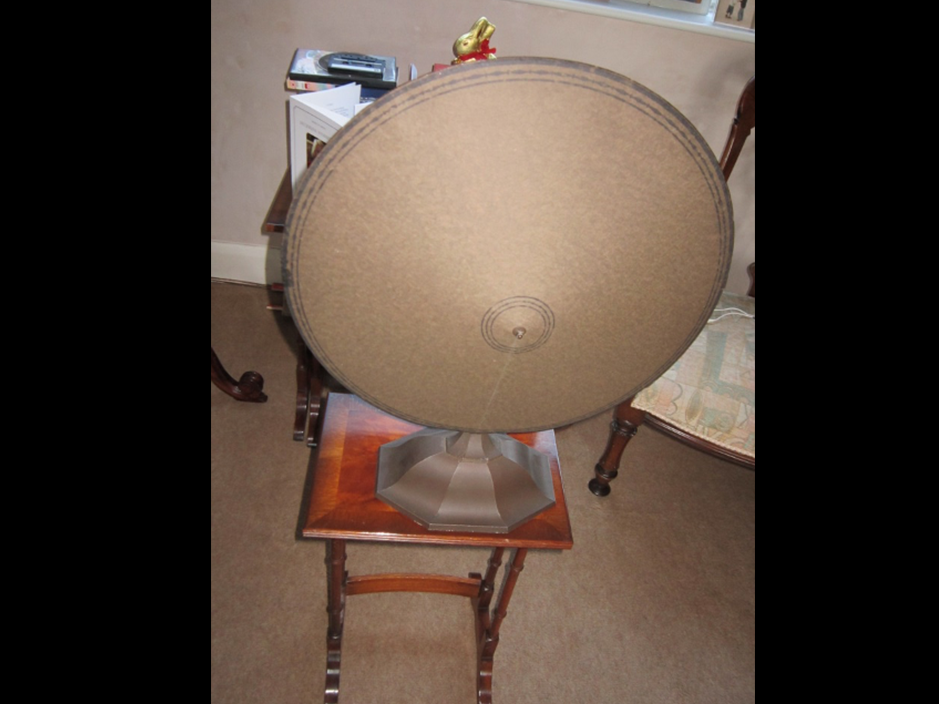
My colleague thought I might be interested to listen to the unit before he put it back in the attic (or on EBay). I popped round one weekend and there it was connected up to a modern hi-fi amplifier, via a matching transformer, as the unit has a high impedance, having been designed to be directly connected to the amplifier the anode circuit. I am not sure what I was expecting to hear, very limited bandwidth and lots of distortion? So I was really quite surprised to find that it actually sounded pretty reasonable, though clearly lacking high frequencies. However, it quite happily entertained us by playing music from a popular classical music station. The unit is a dipole, with just as much sound radiating from the rear as the front – though actually with subjectively more HF.
I could not resist it and although I had not really come prepared for a measurement session, I was able to grab a few quick responses on the fly. The signals were recorded and processed later, so I had no idea at the time what the results were.
Figure 1 shows a frequency response measurement made on axis using a log sweep. Figure 2 shows the same measurement overlaid with the corresponding measurement made at the rear of the unit.

Figure 1 – On-axis response – log sweep measurement.

Figure 2 – Frequency response with rear response overlaid
Out of interest I also measured the response using a broadband pink noise signal, analyzed in standard, contiguous 1/3 octave bands. I then compared this to the sweep measurement by also converting this to contiguous bands. It was good to see that the two very different methods are in good agreement, as it was thought that there might be a potential difference due to distortion effects. The blue curve is for the pink noise measurement and the red for the converted sweep.

Figure 3 – Comparison of pink noise and log sweep measurements (1/3rd octave discrete filters)
Although not measured specifically, I was also able to extract some basic distortion information from the recordings. Figure 4 shows a plot of the lower mid and mid-frequency THD and figure 5, the harmonic distortion components which show that the distortion is predominantly 2nd harmonic.

Figure 4 – Total Harmonic distortion – at average (uncalibrated) listening level
My colleague, who is now in his 80s, wondered if loudspeakers had really progressed all that much in the past 90 years. We most certainly have but I understood the point he was making. Equally, it is interesting to see just how much information can be extracted on the fly from a few simple measurements.

Figure 5 – Distortion Analysis
I was also interested to see how the impedance of this different loudspeaker mechanism compared to the more usual moving coil devices we are familiar with. The impedance plot is shown in figure 6.

Figure 6 – Impedance curve for Vintage Western Electric balanced-Armature Loudspeaker
My colleague, who is now in his 80s, wondered if loudspeakers had really progressed all that much in the past 90 years. We most certainly have but I understood the point he was making. Equally, it is interesting to see just how much information can be extracted on the fly from a few simple measurements. pm

