Peaks vs RMS – Keeping Peaks in Their Place
Peaks vs RMS: This article explains why the modern obsession with “peak performance” represents a step backward in developing meaningful ratings and performance metrics for audio equipment.
I’ve enjoyed watching audio technology advance over the past decades, and I enjoy reading the history of what was developed before my time window on earth. While our modern tools are amazing, it is important to not forget the body of work that paved the way for them.
It’s been nearly a century since the invention of audio metering. There are two major characteristics of the waveform that a meter may be used to track – peaks and RMS. One generally watches the peaks to assess fidelity, and the RMS to assess power generation. Loudness is a complex characteristic of human perception that is related to the RMS signal level. While rediscovered (hopefully) by every generation, it was realized very early in the game that humans are not sensitive to slight-to-moderate clipping of the peaks in high crest factor waveforms like speech and music. That seems implausible, but it is true.
An Example
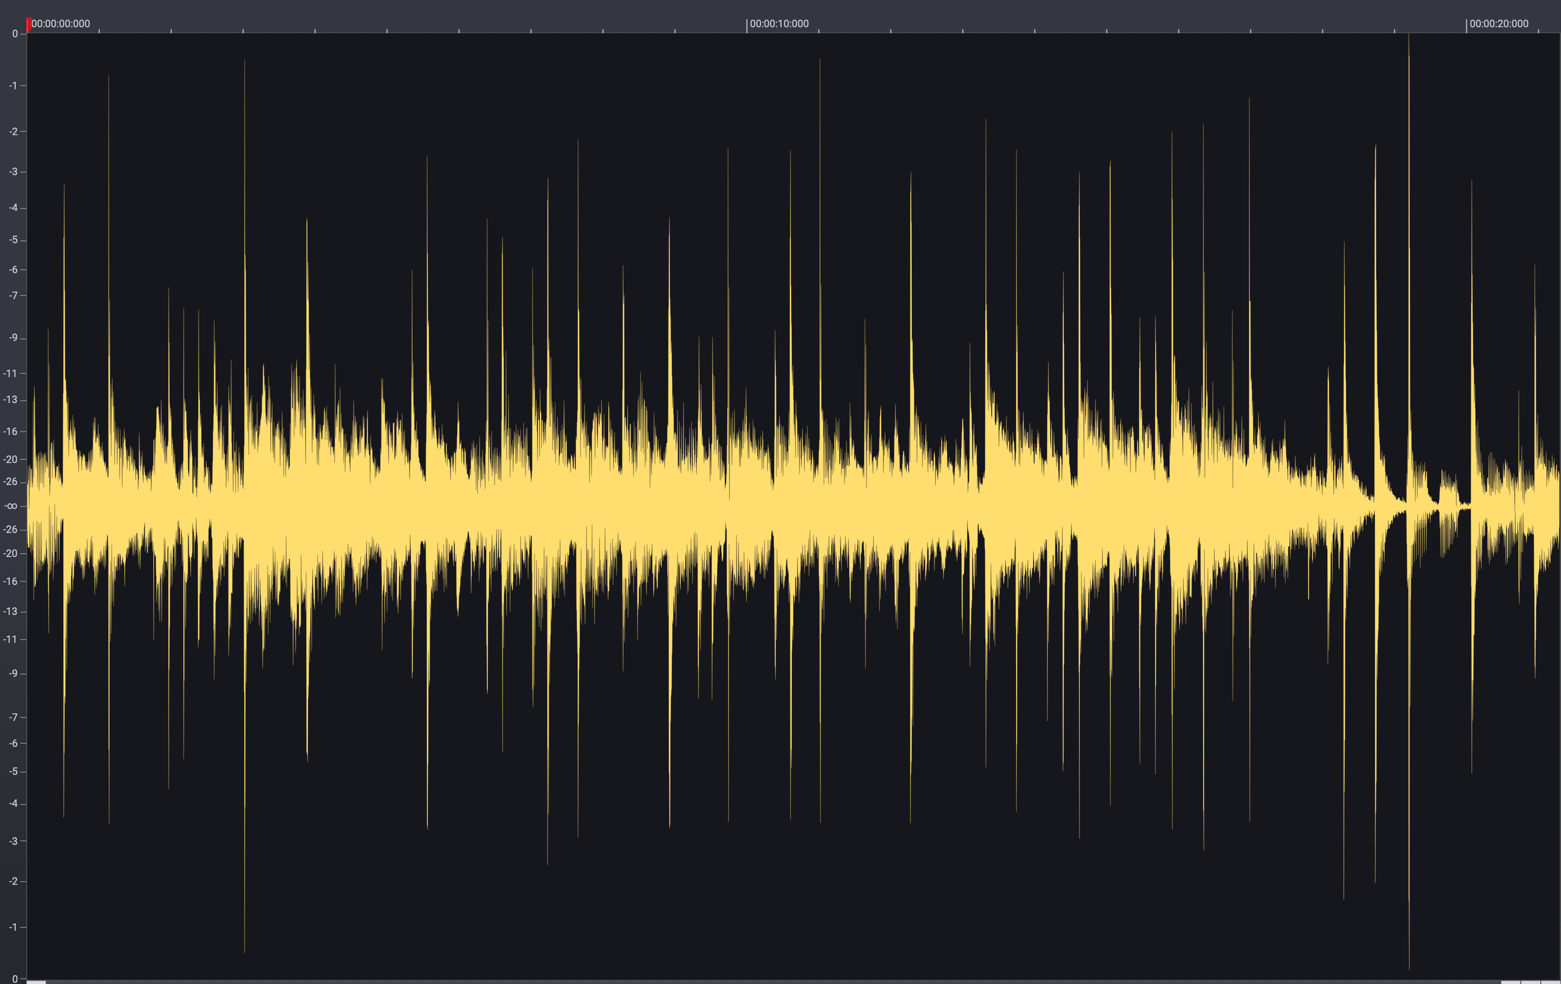
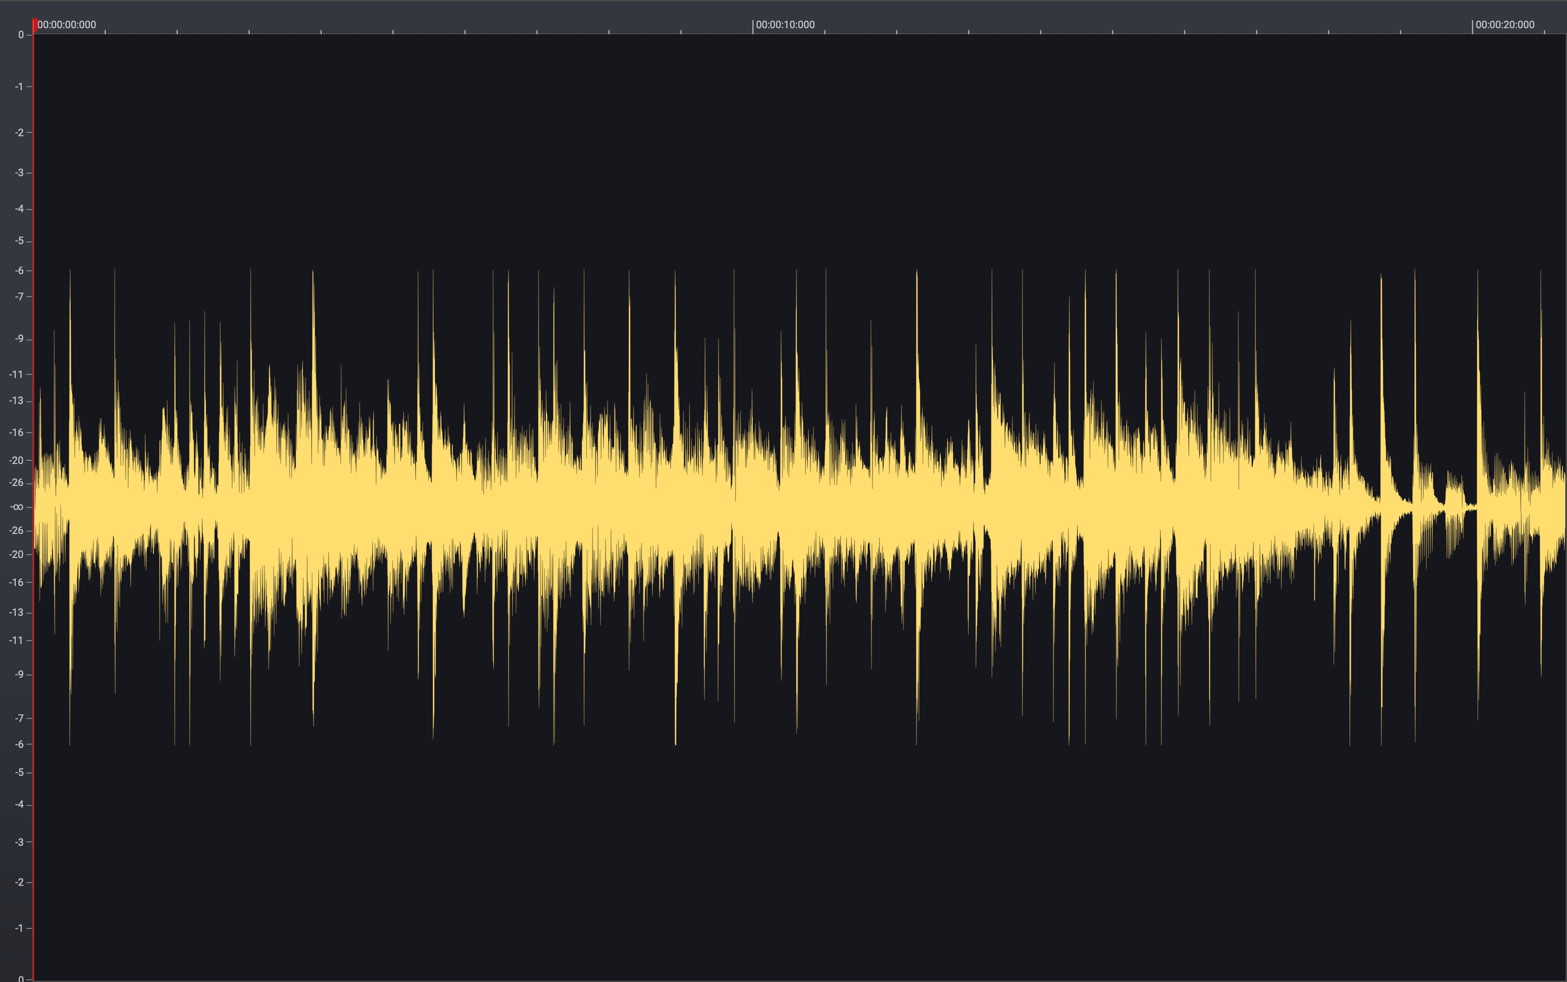
Consider the waveform shown in Figure 1. This music track contains peaks that reach full-scale and has a peak-to-RMS ratio (crest factor) of 20 dB. One would think that the reproduction of these peaks would be vital to high fidelity sound. Figure 2 shows the same waveform but the peaks have been clipped (not limited) by 6 dB, reducing the crest factor to 14 dB.

Figure 1 – A passage of raw (uncompressed) music. The crest factor is about 20 dB.

Figure 2 – A passage of clipped music. The crest factor is about 14 dB.
You can play each one and listen below. The raw waveform is first.
Wave File 1 – Unclipped music.
Wave File 2 – Clipped music.
You would be hard-pressed to find a listener that can detect a sonic difference between these two waveforms without predisposing them to the fact that there is a difference. Simply put, they sound the same. Why? Let’s look at some facts about peaks that have been known for a century.
Peak Facts
1. A waveform peak has very little energy content and therefore generates very little power due to its short duration. For this reason, “peak power” is an oxymoron.
2. Human hearing has a time constant with regard to sound perception. By design, we integrate over time concerning perceived loudness. A 300 ms event sounds louder than a 30 ms event, even if both are the same amplitude (Figure 3). A Dirac impulse of the same amplitude yet would be barely audible. Peaks contribute very little to perceived loudness.
3. The peak program meter (PPM) was invented at about the same time as the volume indicator (VU meter). With an integration time of 6-8 ms, a PPM by design ignores very short duration events, making it more of an “audible” clipping meter than an “actual” clipping meter.
4. Peaks are difficult to detect, difficult to observe, and difficult to measure. Only in relatively recent history have we had instrumentation to accurately quantify signal peaks. The wave editor shown above is one example.
5. Many audiophiles have a preference for the sonic characteristics of vacuum tube amplifiers. These amplifiers are inherently poor at peak reproduction. Their “peak rounding” behavior has even been described as adding “warmth.”

Figure 3 – A Dirac pulse, 30 ms sine burst, and 300 ms sine burst. All three have exactly the same amplitude (peak level) but different RMS levels.
Drum Roll, Please…
The take-away? Like it or not, short-term peaks are simply not that important with regard to sound reproduction. Intuitively it seems like they should matter, but in practice, they do not. This was better understood 50 years ago than it is now. What do I base this on?
– Some analog mixer manufacturers advocate output levels that exceed 30 dBu to provide more “peak room” for a +4 dBu RMS level.
– Some amplifier manufacturers are reverting to “peak power” ratings that were basically outlawed by the Federal Trade Commission back late last century because they deemed to be a deceptive marketing practice.
– There is a standard under consideration for a noise test waveform that purportedly “enables far more accurate measurement of a loudspeaker system’s linear peak SPL than any other existing method.”
These practices do indeed produce bigger ratings that produce a marketing advantage to the naïve consumer. More is better, right? Not necessarily. A peak-based rating system will rate an amplifier that can just reproduce the waveform in Figure 1 four times higher than one that can just reproduce the waveform shown in Figure 2, and we have already established that there is no audible difference between these two waveforms!
Loudspeaker Power Ratings
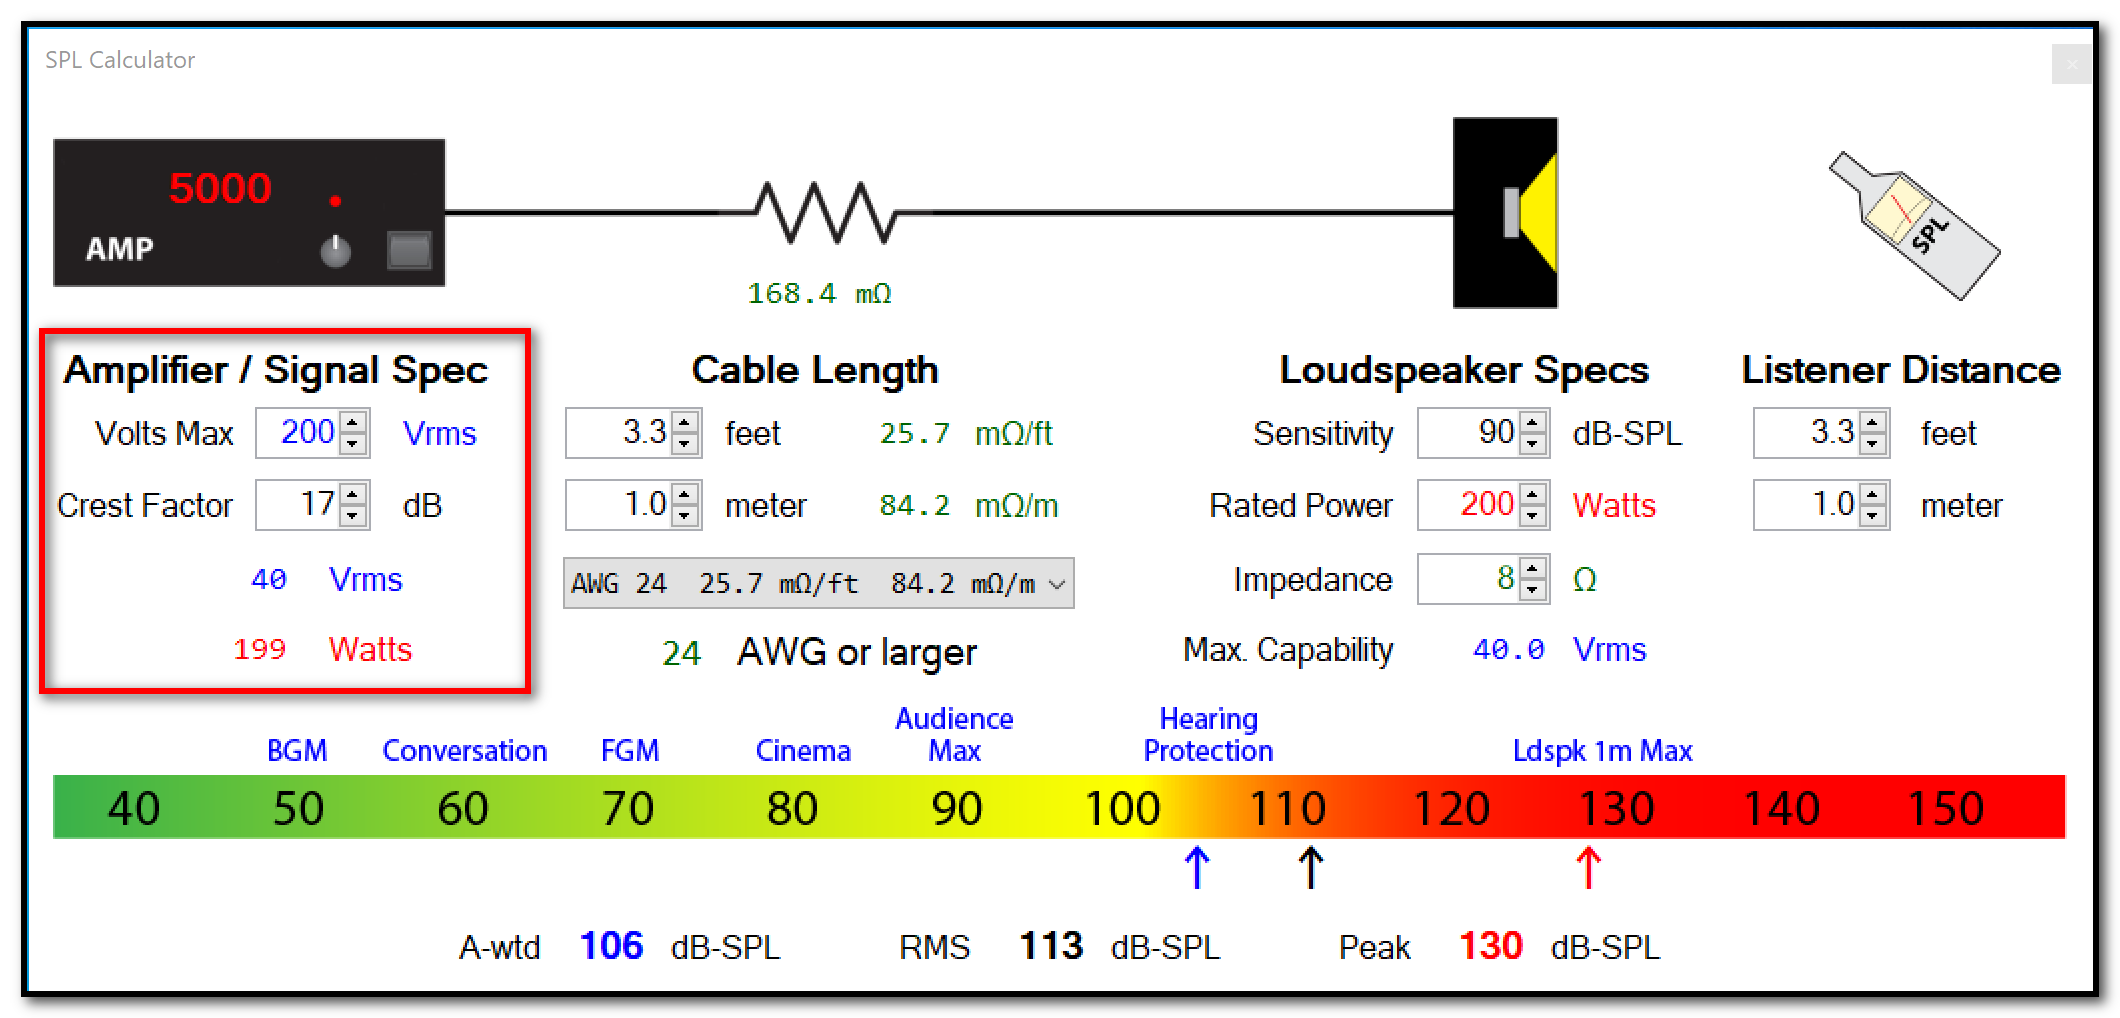
A loudspeaker power rating is a thermal limit, based on thermal criteria such as power compression. It’s the RMS characteristic of the drive signal that produces heat in the loudspeaker. To find a loudspeaker’s thermal limits, it is typically driven by a waveform that has been intentionally clipped to a 2:1 crest factor (6 dB) and shaped to a spectrum consistent with music program. This allows a higher RMS voltage to be produced by an amplifier. Adding short-term peaks to the waveform is a detriment to determining a loudspeaker’s power rating, as these will make the amplifier clip long before the loudspeaker’s thermal limit has been reached. Even an amplifier rated at 5 kW (if there were such a thing) could only output 40 Vrms if 17 dB of room is left for peaks (Figure 4).

Figure 4 – The CAFViewer Low-Z Calculator set for a 5 kW (theoretical!) amplifier. The RMS voltage attainable is insufficient to produce power compression in many loudspeakers. Amplifier test waveforms are intentionally clipped to produce a higher RMS voltage.
Amplifier Power Ratings
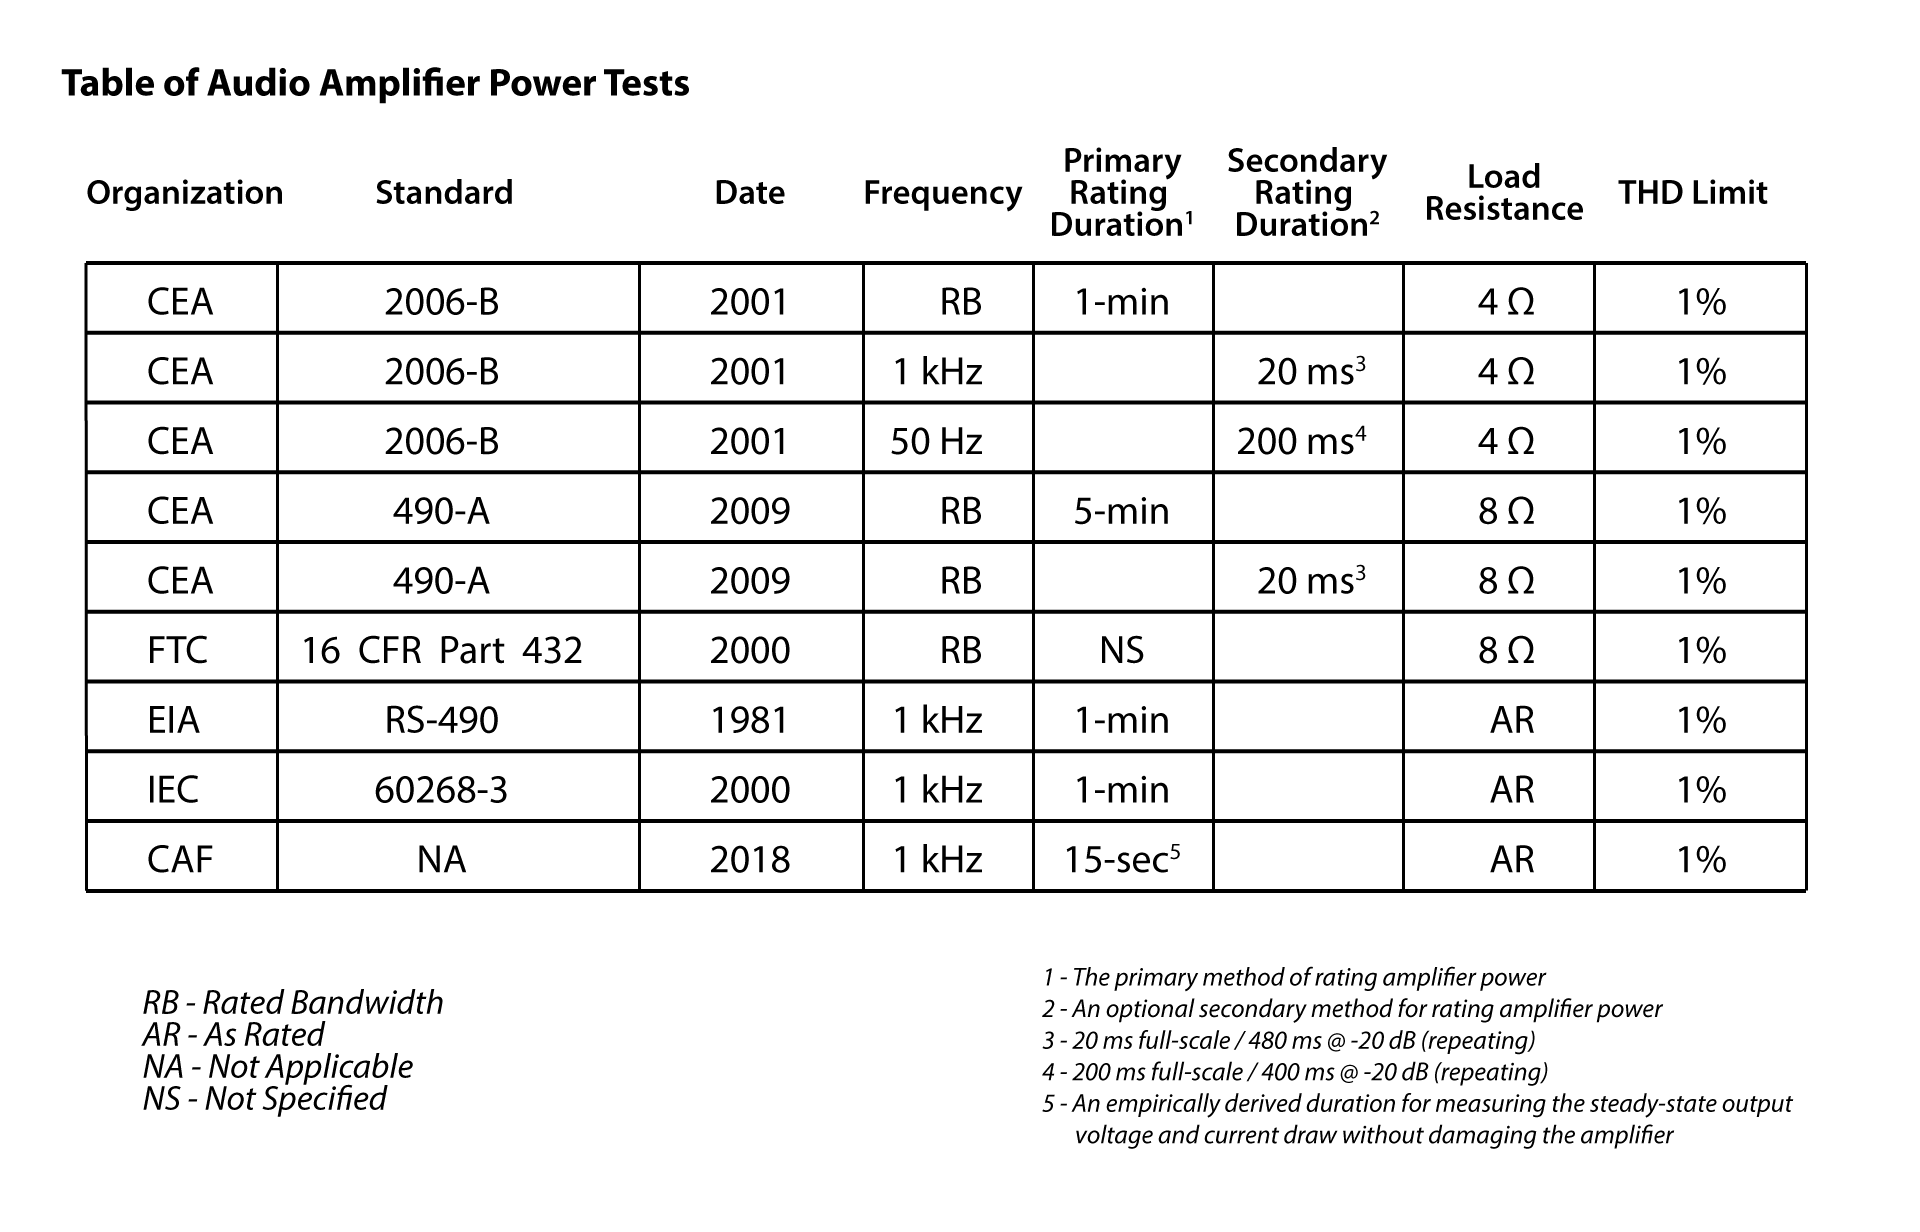
An amplifier power rating is no different. Power is a “rate” and therefore requires some time to pass for assessment. Since by definition one watt is the flow of one joule of energy for one second, any period less than one second isn’t long enough for assessing power. You can’t determine the speed of a car from a snapshot. For the same reason you can’t determine the power from an amplifier from a peak. This was well understood by those that produced the variety of audio power standards. I have compiled a table (Figure 5). Note that the minimum period for amplifier power assessment for any standard is one minute, and some are longer. “Peak power” and “burst power” are oxymorons, as these waveforms do not produce much power due to their high crest factors. CEA-490 permits the specification of the short-term performance of an amplifier as “dynamic headroom” above the amplifier’s continuous (1-minute) sine wave power rating, but even this is specified as a secondary rating. It doesn’t tell us much if given apart from the primary rating.

Figure 5 – Table of audio amplifier power rating standards
Conclusion
We’ve had methods for decades that can readily establish the peak and RMS performance of both amplifiers and loudspeakers. Let’s not forget the body of work done by those who came before us. The modern obsession with “peak performance” represents a step backward in developing meaningful ratings and performance metrics for audio equipment. There are standards in place for quantifying both the long and short-term performance of audio products. We just need to use them. pb
“Those who cannot remember the past are doomed to repeat it.” – George Santayana
