Acoustic Measurements Without Computers
By Pat Brown
In this article, Pat Brown shows how to record acoustic measurements without a computer and get better data.
It is difficult to describe how something sounds. The terms are vague and subjective, and often have different meanings to different people. Sound is meant for listening, and the listening process is the most power diagnostic tool for the audio technician. Measurement systems yield lots of data, but it can be
difficult to interpret. It makes perfect sense to combine the hearing process with the measurement process, allowing the benefits of each to be exploited.
The processes of convolution and auralization allow measured data to be evaluated by listening. The method that I use requires the system impulse response (IR) to be saved as a .wav file. Wave files are the default file format for several measurement applications. Others are able to export their data as wave files. I then post- process the IR in the SoundForge™ Acoustic Mirror module to listen to the data encoded on music or speech (www.sonicfoundry.com).
Of course, all of this requires a personal computer. This can be a hassle, as computers can be awkward and unwieldy when used to evaluate different listener locations. The setups can be time consuming, requiring very long cables, interface boxes, etc.
Ironically, the power of the personal computer can allow the system IR to be gathered without it. This Tech Topic describes one method to gather the system IR without a PC, and how to post-process the data to evaluate it and listen to it.
The Impulse Response
The impulse response (IR) is without a doubt the single most important acoustical measurement. It is also one of the oldest, having been implemented by hand claps, balloon bursts, starter’s pistols and even yachting canon fire. Within it lies a wealth of information about the sound system and acoustic environment. The principle is simple – whatever the room does to your hand clap, it will also do to your voice, or to a musical instrument played at that location in the space. The IR is the “signature” that the room places on the sound. Once the IR is gathered at a listener position, it can be analyzed to reveal information about the early and late reflected fields, and the diffuse field of the room. If the sound system is used to excite the room, the IR will also contain information about the loudspeaker’s response and resultant performance as it relates to speech intelligibility and music clarity. In short, most system/room characteristics that can be heard at a listener position will be included in the IR for that position.
Many wave editors (SoundForge™, Cool Edit™) have the ability to convolve two files. This means to take one file (time or frequency data) and encode it with the characteristics of another (time or frequency data). If one file is dry program material, and the other is an IR gathered in a room, the convolution will yield what the dry program material would sound like when encoded with the acoustic characteristics of the live space for that specific position. The entire process of convolving an IR with dry program material and then listening to the result is known as auralization. Ideally, the IR should be binaural (two channels gathered with a stereo microphone). This preserves many of the localization cues required by listeners to pinpoint a sound in three dimensional space. The benefits of auralization are obvious:
- • Speech or music can be evaluated without making actual recordings of talkers or musicians.
- • The IR can be modified to simulate acoustical changes to the space. Auralization will then simulate the benefits of the changes.
- • There are signal-to-noise advantages over recordings. If the IR is gathered in a noise-immune manner, then the auralizations will have a lower noise floor than actual recordings made in the space.
- • The IR is a complete documentation of the room/ system response at one listener position. It can be reprocessed in the future as better algorithms become available.
Regardless of what measurement platform you use, a properly gathered IR should have the following characteristics:
- 1. When displayed on a dB vertical scale, the data should fill the screen from top left to bottom right.
- 2. The full decay of the system must be measured, meaning that the decaying tail must not be truncated.
- 3. For auralization purposes, good signal-to-noise ratio is required. I like to have at least 90 dB of dynamic range, and see the decaying energy fade into the noise floor at -80 to -90 dBFS (See below).
Eliminating the Computer
Deconvolution is the opposite of convolution. A known stimulus is played into a room and the response recorded, The difference between the two files is the IR, which represents what the room/system did to the sound as it passed from source to receiver. One way that the IR can be obtained is by a complex mathematical process called deconvolution. A number of software applications exist that can deconvolve two files. I used SoundForge in this example. There are other mathematical processes that can be used to get the same result, but the principle is the same.
The system excitation stimulus need not be an impulse. In fact, impulses are a poor choice. A swept sine wave offers some significant advantages:
- • Significantly more energy is fed to the room. This offers dramatic signal-to-noise benefits.
- • It’s less likely that you will overload your recorder, since the level of a sine wave doesn’t fluctuate like a noise or impulsive stimulus.
- • The simple nature of the waveform allows the recording to be done with most any digital platform. Complex waveforms can be significantly altered by the compression schemes used by some formats.
- • It is relatively easy to set recording levels.
Beware that since sine waves generate significant power (that’s why you get a better signal-to-noise ratio), that you do not burn up the loudspeakers used for the test.
The Equipment
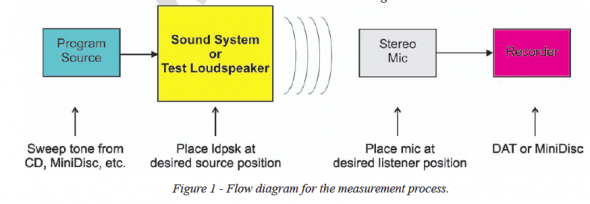
There are lots of possibilities here. My setup consists of things that I already had. I created a wave file that contains a 24 second sweep, a 48 second sweep, and an anechoic speech track. The total duration is about two minutes. I use a MiniDisc player to play the file into the system. It’s a cheapie unit that runs on batteries. As a separate unit, it eliminates the need to string long cables in the venue to excite the system. The file is recorded on another MiniDisc player/recorder. This one is a little nicer, with XLR inputs and phantom power. It also has SPDIF outputs, which allow the recorded files to be transferred to the PC without converting to analog. Some of the newer recorders use compact flash or CD media. This is even better, since you can then simply pop the disc into the PC for post-processing. My mic is a Crown SASS™, ideal for this application since it emulates a human listener. All of this fits neatly in the SASS case.
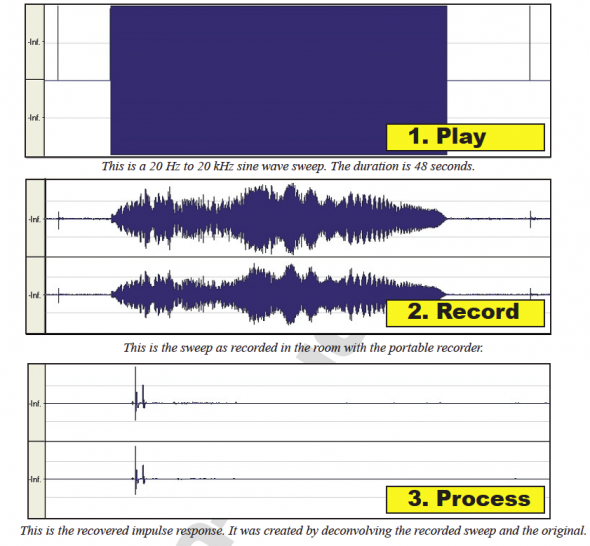
The data is gathered by playing the wave file into the system and simply recording it. The 24 second track is used to set the levels, and the 48 second track is the actual file used for post-processing. The speech track is used to provide a reference for what the measurement position sounded like. It can later be used as a reference to compare the auralized files to. The whole process takes about two minutes per listener location.
Post-Processing
SoundForge provides a nifty utility to recover the IR from the recordings. First you must transfer the recordings to your PC. Next, open the recording in a wave editor and create a new track from the 48 second sweep portion of the recording. The user then simply specifies the source file and recorded file and selects “Recover Impulse” to recover the IR. The process takes a few seconds, and a new file is created that contains the IR. You can hit “play” and listen to the impulse.
The Possibilities
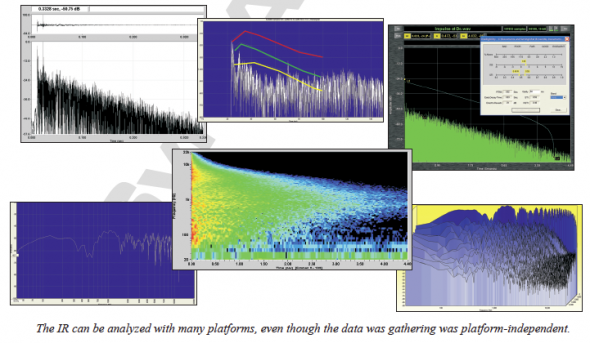
Now the fun begins! The IR can be opened on Smaart™ Acoustic Tools, WinMLS™, or TEF-MLS™ (all can open wave files) and processed to yield the various acoustic metrics. It can be auralized with dry program material in SoundForge, Cool Edit™, or the EARS ™ module of EASE™. The user is free to exploit the strengths of all of these platforms (plus their ear- brain system) to analyze the data. It also allows for easy comparison of the measurement platform algorithms. You will quickly develop some favorites that are more meaningful to the way that you think about sound, and that help you draw meaningful conclusions from the data. Such files can be exchanged with colleagues for consultation, and can serve to document the before-and- after performance of a sound system renovation. They are also excellent for archival purposes. How would you like to have an IR of the Fogg Lecture Hall where Sabine derived his famous equation? We could enter that space and listen to it, as well as many others.
IR testing is nothing new. We just have a few new tools that help us make better use of the data. All serve to make us better measurers and better listeners, ultimately resulting in better sounding systems. pb


