Interpolated Balloons
Jeremy Johnston addresses this question, “What are interpolated balloons?”
When we use modeling programs to predict the direct field coverage of a loudspeaker system in a space, we depend on the loudspeaker model to show all of the coverage data for each frequency band of interest. The manner in which the loudspeaker data is collected is rarely given much thought because the resultant balloon and coverage pattern is thought of as a system wide variable; i.e. ‘the “box” behaves this way in this frequency range’.
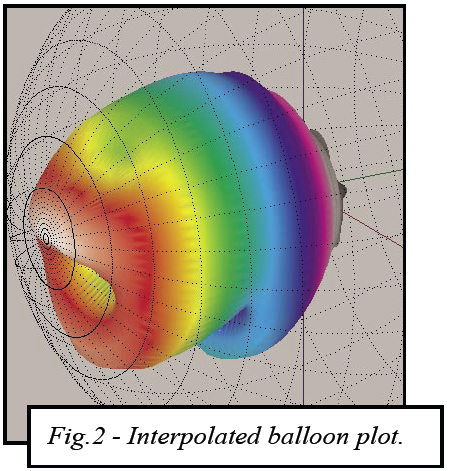
One method of generating a loudspeaker coverage balloon involves measuring the magnitude of the frequency response of the loudspeaker at five degree increments around its horizontal axis to 180°, then in five degree increments from 0° to 90° on it’s vertical axis and creating a balloon that represents the loudspeaker coverage in 1/3 or 1/1 octave bands by connecting the dots with a smoothed curve (see Figure 1). These measured data make up the horizontal and vertical polars. The data between 0° and 90° on the vertical axis are interpolated in order to generate the complete balloon (Figure 2).
Interpolation is a method for estimating a value in between known values. Interpolation is used because measuring the actual data for a loudspeaker at various angles is difficult in practice and is rarely done. The result is that the balloon data may not accurately represent the response of the speaker at off-axis angles that are not in the horizontal or vertical plane of the loudspeaker. This is particularly egregious when the drivers in a loudspeaker are not in the same horizontal or vertical plane. The balloon data that is generated from horizontal and vertical polar measurements will not show this offset and will misrepresent the response of the loudspeaker off-axis. For a symmetrical loudspeaker, such as a co-entrant or co-axial design, the interpolated data may not be far off, but it will still miss subtle anomalies created by the edges of the device or changes in the patterns of multiples devices at crossover. Think of trying to completely describe the shape of an apple with a bite taken out of it (arguably NOT completely symmetrical) from a wafer thin slice taken horizontally around its middle and another, similar slice, taken vertically. When we use direct field modeling programs such as EASE, CATT Acoustic, Ulysses or LARA we assume that the data shown on the direct field plots represents what the loudspeaker is actually doing. With interpolated data we could be missing important information about off-axis areas in the seating plane.
Figure 3 shows the fully measured balloon for the same device. The crossover region (2000Hz) was selected because it reveals frequency region with the potential for greatest error. Interpolated data for this device is wildly inaccurate, yet still published and used by designers.
The solution to this is measuring all of the data points and not using interpolation. This is a difficult solution and requires a fairly complex rotation mechanism, but the results will be very telling of the response of the loudspeaker off-axis. jj


