Error Sources in Loudspeaker Data
by Pat Brown
The accuracy of sound system performance predictions are limited by a number of factors. These include but are not limited to the loudspeaker data.
Much good research has been done in recent years on loudspeaker data formats for room modeling programs. With Standards in this area likely to emerge in coming years, I thought I would offer some food for thought from the perspective of a combination user/measurer.
There are two major uses of loudspeaker data in the audio industry. The first is to characterize the loudspeaker’s response, and the second is to aid in predicting its performance. It is important to make this distinction.
Looking from the outside in, it is logical to assume that “more is better” for all uses, and that higher angular and frequency resolution should automatically produce better predictions. Having been involved in measuring spherical loudspeaker data for room modeling programs for several years now, I have invested significant resources into determining what is really relevant with regard to modeling the performance of a loudspeaker in a room. My motive is efficiency, as there are significant “time/money” vs. “useful results” trade-offs in the choices made.
The sound system practitioner must understand what performance characteristics can be predicted with reasonable accuracy, and what behaviors must be dealt with “in situ” where all of the variables are in play and observable.
Is More Always Better?
If you are in the measuring business, it is in your best interest for “more” to be “better.” It’s much more profitable to collect full complex data at say 2.5-degree angular resolution than magnitude-only data at 5-degree or 10-degree angular resolution. But, it’s also more time-intensive, costs the customer more, and reduces the number of manufacturers interested in providing measured data in the first place. So, unless there is a reason for more, less may be better. Here are a few observations that add balance to the discussion:
1. Loudspeaker responses will vary from unit to unit. While it is feasible to collect loudspeaker data at almost any desired resolution, it is of little utility to do so if there is significant response variance from unit to unit. How much do they vary? Unfortunately no one knows. Figure 1 shows the overlay of ten “identical” cone-type transducer axial responses. This represents the simplest of devices used in sound systems having no crossover networks and in sealed enclosures. Level variances of up to 6dB exist in this small control group. Unfortunately the largest deviations in magnitude and phase response occur in the frequency region where a crossover network would likely be employed to form a full-range system.
It is a fact that the transducers in sound reinforcement loudspeaker systems are often pushed to their frequency limits, and the greatest variances in transducer response are encountered as these limits are approached.
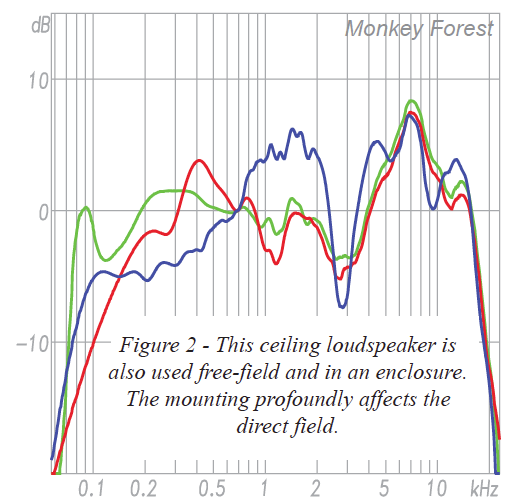
Figure 2 shows three responses of the same model ceiling loudspeaker. These were gathered at different times and under different boundary conditions. One is “infinite” baffle, one is in a 2 liter box, and the third is in a back-box only. Two of the traces are for the same unit, the third is for a different unit of the same model. They should not be the same, and they aren’t. The response of this make and model device is dramatically affected by a number of factors and is not general in any way. If you change anything around the loudspeaker, it becomes a different loudspeaker.
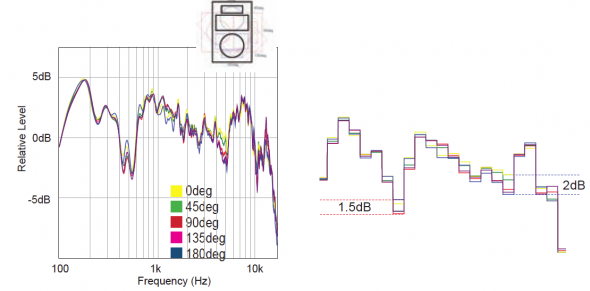
2. Variance will increase with loudspeaker complexity. Multi-way loudspeakers are likely to vary in response from unit-to-unit due to the many variables involved. These include the transducer variances previously mentioned, plus crossover issues, edge diffraction, grill effects and more. Figure 3 shows how much the response of a typical medium-sized 3-way loudspeaker system is affected by a slight aiming error in the measurement setup. Regions of the response that are phase dependent (i.e. crossover points) are especially sensitive (Figure 4).

Fig. 3 (left) – Rotational error in the measurement setup can cause errors. The slight error (~3 deg) was corrected for the actual balloon measurements. Failure to correct such errors produces erroneous data. Fig. 4 (right) – Smoothed versions of the same, showing the variance at crossover due to aiming angle.
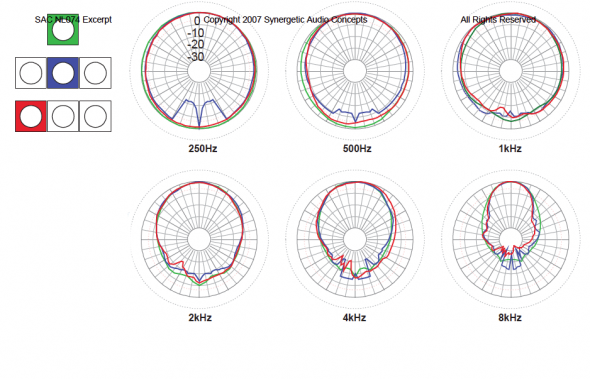
3. A loudspeaker’s response changes when it is placed in proximity to another loudspeaker or loudspeakers. Figure 5 shows how the response of a simple cone transducer in a sealed box is perturbed if it is placed in close proximity to other devices. Figure 6 shows the effect on polar response. The devices used were identical in size and had shorted voice coils to prevent sympathetic vibration. The level variances are on the order of 6dB. It must be said that a loudspeaker placed in such a way becomes a different loudspeaker, and that such effects can only be accounted for if the entire array of loudspeakers is measured as a single unit – a practical impossibility in most cases. Predicting these effects requires computationally intensive techniques not used by room modeling programs.

Figure 6 – The position of a device in an array affects its polar response. The sensitivity difference due to the interaction have been normalized, but must be considered in actual prediction.
The position of a device in an array affects its polar response.
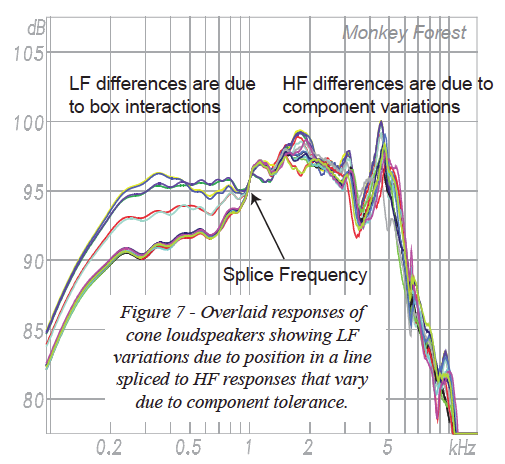
Figure 7 shows the overlaid responses resulting from both device variance and loudspeaker interaction. Note that the effects are cumulative – two separate factors that each produce a 3dB variance can can combine to produce a 6dB variance. Their phase relationship, which is much more sensitive than magnitude response, must also be considered.
4. Spherical measurement methodology will affect the response. Additional errors will occur due to how the loudspeaker is tested. Heisenberg proved a century ago that it is impossible to test anything without influencing the result. Nowhere is this truer than for acoustical transducers. For a loudspeaker to be tested it must be mounted to something. That something must have size and mass, and as previously shown placing an object close to a loudspeaker changes it. The microphone must also have size and mass, and this will also have an effect. Anything near the microphone will also perturb the response. This can include mounting hardware, other microphones (as with microphone arrays), and even “anechoic” wedges. If multiple microphones are used, there will be a variance from unit to unit. If the loudspeaker mounting must be changed as part of the test procedure, this change in acoustic loading and mechanical mounting will affect the result. “Anechoic” is a relative term, and the “anechoic-ness” of a chamber is affected by many factors including proximity of the mic/loudspeaker to the wedges, grazing effects, steel structure and wire grids. The long distances required to be in the far-field of the DUT mean that both loudspeaker and microphone are likely very near the chamber walls.
A large space and a time window can be substituted for an anechoic chamber. The required time window length must be at least three time periods for the lowest frequency of interest (i.e. ~30ms for 100Hz) necessitating a large space or outdoors. Large spaces present difficulties with regard to temperature and noise control. Outdoors presents difficulties due to noise, wind and temperature gradients. The measurement distance must be in the far-field of the DUT at all frequencies of interest. Eight meters is difficult to attain in practice and barely adequate for large devices. The error caused by too-short measurement distances can be significant and it adds to all of the other errors.
In short, there are many factors that can cause the data produced by one manufacturer or test lab to be slightly different than that produced by another. If each lab tests different samples of the same make/model loudspeaker, the variances in the samples described previously prevent the differences in the measurement setups from being assessed. How significant are these effects? No one knows and no careful and comprehensive studies have been performed to find out. Given that loudspeaker data will likely come from dozens of different test setups, errors due to these factors will be significant.
The various loudspeaker testing methods are like everything else that we encounter in engineering – each has a set of strengths and weaknesses and each represents a compromise. Unless all loudspeakers are tested using identical hardware, software and test environments, it is not likely that the data sets will be identical. No standards exist for spherical testing methods, and no certification exists for loudspeaker rotators and test environments. It’s the honor system. The free-field axial response of a loudspeaker is relatively easy to obtain. Spherical data is much more difficult, and it’s the spherical data that is needed for designing systems.
Prediction Limitations
Sound system modeling programs do not account for any of these error sources. They necessarily assume that all manufactured units of a particular loudspeaker model are identical. They cannot account for box interactions caused by acoustical reflections by simply adding individual box directivities. Modeling programs produce valid results within the confines of the data we give them and the necessary assumptions regarding acoustical calculations. As has been shown, there are some significant factors that they can’t account for, even with direct field only modeling.
These errors can be significant and will exist regardless of the resolution of the data.
What Resolution?
Figure 7 shows the complex transfer function of a popular multi-way loudspeaker. There are over 32k points on the magnitude response curve, producing a high degree of detail. At this resolution it is unlikely that multiple units of the same model will have identical responses for all of the reasons previously stated. As such the detail in the response is excessive for sound system modeling purposes and (arguably) even for general characterization of this particular loudspeaker model. I say arguably because the manufacturer can implement strict quality control measures to counter some of this.
There exists an inverse-relationship between frequency resolution and generalization of the loudspeaker’s response. Remember that a spec sheet or loudspeaker data file is considered to be representative of all units manufactured. Variances that are device-specific must be excluded. At 16k+ FFT data points the responses of presumably “identical” units will be different due to the multitude of factors that influence the response. As frequency resolution is reduced, these differences average out and are diminished. This is why less can be more with regard to loudspeaker data.
The flip side is that as resolution is reduced, the subtleties of the response are lost and it becomes increasingly difficult to distinguish one loudspeaker from another by comparing data. One cannot cannot conduct “shoot outs” with measured data alone.
One of the stated purposes of loudspeaker data is to generalize the response of a loudspeaker in order to make meaningful and informed decisions during the sound system design process. As I have shown, if the resolution is too high, then the data ceases to become a generalization and instead becomes a characterization of the individual unit tested and the environment in which it was tested.
Loudspeaker Tuning
Many loudspeaker types require active signal processing. This may include equalization and a crossover network. The proper settings must be determined from high resolution measurements in both the time and frequency domains. Such measurements do and should contain all of the subtleties of the loudspeakers response. As I have shown, these subtleties can vary significantly from unit to unit. While a manufacturer can and should supply recommended settings, these are a generalization and must always be tweaked “in situ” to account for differences between the unit tested and the one installed into the room. In short, loudspeaker tuning must be completed “in situ” to account for all of the variables.
It is important to make a distinction between data that is suitable for general characterization and prediction work and high resolution data that is suitable for system tuning. They are not the same. In sound system work we can always measure the end result and see how all of the variables have played out. Such measurements are performed “in situ” with one of the many quality measurement platforms.
Clearly, regardless of the resolution used, the predicted results will at best be an approximation of the actual response. This fact is independent of the data resolution.
Conclusions
1. Sound system modeling software can provide drawing board estimates of key areas of performance. These include direct field coverage, phase interactions between idealized sources, and a number of acoustic metrics. I have shown significant variables that cannot be accounted for by these programs, regardless of the resolution of the loudspeaker data used. This suggests that practical limits have been reached with current modeling methods. The sound practitioner must understand these limitations and work within them.
2. Performance predictions and loudspeaker tuning are different processes that require different data sets. We cannot collect polar data in performance spaces, and we cannot equalize the system in the anechoic chamber.
3. The modeling process requires a general characterization of the device. General characterization using magnitude-only 5-degree resolution data has been in use for many years. Such data can be collected without extreme measures, is repeatable, and is not grossly affected by some of the error sources described.
In performing this investigation, I did not test a great number of scenarios and select the worst cases for inclusion. Given my limited access to multiple devices of the same model and the significant cost of acquiring these independently to conduct a study, these are the only data that were measured. Further detailed studies of various makes and models across a sampling of manufacturers would likely find cases that fare better and others that fare worse. The fact that such studies have not been done should raise concern regarding the adoption of polar measurement practices that produce results that are device-dependent.
Computer modeling is a vital part of the sound system design process. Any responsible designer should be doing it. It is incumbent on the system designer to understand the limitations. These limitations can be attributed to each part of the modeling process. These include loudspeaker data accuracy, loudspeaker performance consistency, limitations of the prediction algorithms, inability to account for boundary conditions, acceptable processing time and others. Research is ongoing in each area, and all must be addressed before prediction accuracy will increase. Excessive data resolution can burden the measurement and prediction processes without increasing the accuracy of the results. pb


