DSP Comparsion – Part 2
DSP Comparison – Part 2 – Downloadable pdf.
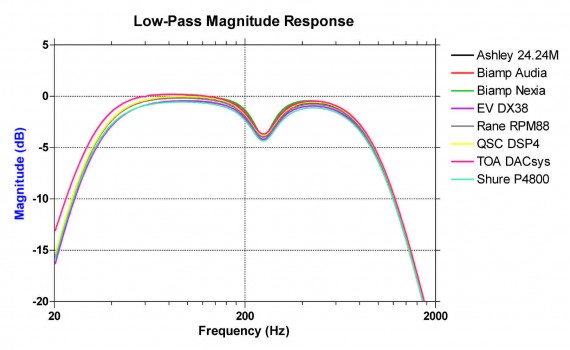
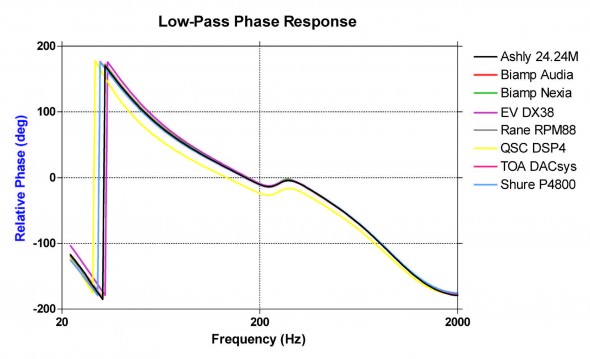
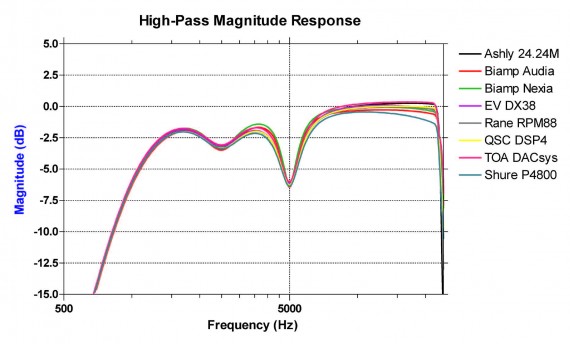
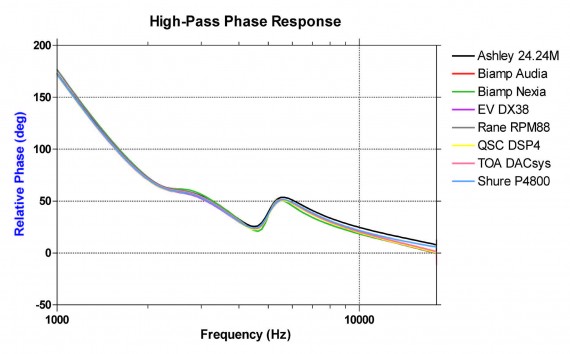
Last issue we presented a comparison of the transfer functions (TF) of various Digital Signal Processors. The conclusion was that differences exist in their transfer functions, even when programmed with the same numerical settings, and that the differences are likely to be audible.
The response to the article was overwhelming. This seems to have sparked some interest, observation, and even debate among our members. In Part 2, I will clarify and refine some aspects of Part 1, and include some additional commercially available DSPs into the lineup.
First, An Apology
It was brought to my attention that the transfer functions of two of the DSPs tested were swapped in the graphs – the BSS Omnidrive and the QSC DSP-3. This implied that the TFs of the two QSC products tested had significant differences, when in fact they are essentially identical. My apologies to QSC and their engineering staff for this oversight. I tested a DSP4 this time. Its response was identical to the QSC522aa so I elected to omit the latter from the lineup.
Common Denominators
It became apparent from the Part 1 that there is no widely practiced way of implementing a high frequency shelving filter. The units tested correlated poorly for this part of the test. In this installment the shelving filter has been removed so that the units can be compared regarding
the more standardized filter types:
1. High Pass Linkwitz-Riley
2. Parametric Band Reject
3. Crossover Network
These filter types are likely to be included in any application of these devices as loudspeaker processors. Also, in Part 1 the 30Hz 4th-order high-pass filter in the low frequency section was emulated by cascading two second-order Butterworth filters for several of the units.
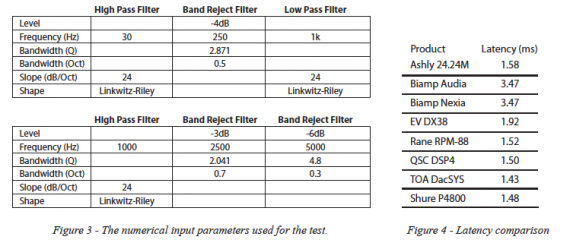
This is common practice, but the result is not a 4th-order Butterworth. This time I have used the 4th-order Linkwitz- Riley as it is more univeral among the units tested. Thanks to Dennis Bohn of Rane for pointing this out and to Dr. Eugene Patronis for confirmation. The numerical settings are shown in Figure 3 in a format typically used by loudspeaker manufacturers.
Measurement Hardware/Software
Different measurement hardware was used to test this batch of DSPs. The hardware is the RME Hammerfall DSPTM with a sampling rate of 96kHz. This allows better characterization of the HF response of each unit. The software is Monkey ForestTM, a DOS-based application
from Swen Muller that is particularly well-suit for electronic and electro-acoustic measurements. MF allows export of the data in ASCII format, which was then plotted on a common graph with a third party graphing application.
DSP Selection
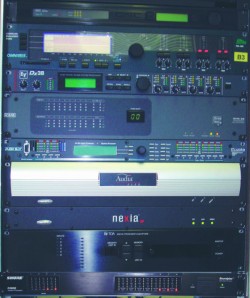
The 8 DSPs (Figure 1) in the study were used primarily because of their availability. We have some of these on hand. Others were supplied by manufacturers or reps in response to Part 1.
As with the last installment, the comparison is not a shoot-out with a winner and loser. It is to illustrate that when given the same numerical input parameters, the resulting transfer functions have measurable differences,differences that would likely be audible in an A-B comparison of the units. No other conclusions are intended.
Other Tests
More notable than the relative TF differences were the very significant differences in gain structure, latency and control protocol. I actually started on a gain structure comparison chart, but quickly found that there was no universal way to compare these devices. The idea of a “unity gain signal processor” as with analog electronics only applies in a few cases. When fed a 1V RMS 1kHz sine wave, most of the devices produced an output signal within 6dB of the input signal, but there were huge differences in the available headroom, ranging from 6dB to 20dB. All could be made to work, but the required adjustments were different for each unit and hardly ever logical.
Hardware metering, when provided, also varied significantly from unit to unit. Some use peak meters, some average. Some used the classic Volume Indicator format, others used Peak Program Meter format. Some combined PPM format with VI ballistics. Don’t assume anything without further investigation when observing the meters on any of these devices. All of the meters are useful once you know what they are showing you.
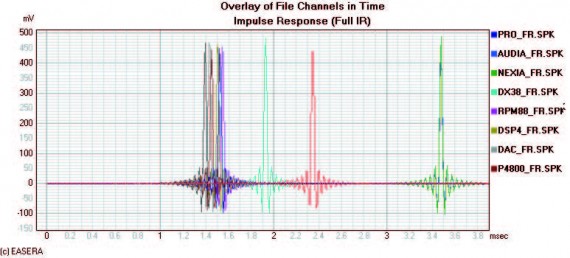
The plot in Figure 2 shows the IR of each unit when set to simply pass the test stimulus with no processing. The same information is provide in Figure 4. It shows that digital devices always delay the signal by a few milliseconds. Unless you are mixing units from different manufacturers in the same system, the latency differences are not likely to be an issue.
In conducting this study it was apparent that the greatest difference between the devices tested was in control. Three of the devices provided front panel setup – convenient with relatively low resolution compared to PC interfaces. Several were controlled via RS-232. While this may at first appear antiquated, it proved consistently to be the simplest, most reliable and straight-forward
way to talk to these boxes. The 10baseT Ethernet controlled units offer a lot of flexibility, but at the price of dealing with the intricacies and subtleties of network communications. This won’t be a big issue to an end user that works with mainly one brand, but jumping between brands is a major hassle, requiring different static IP ranges, subnet masks, and other settings. The thought “This ain’t audio!” kept flashing through my head. Once on-line, all worked as expected.
Conclusions
This batch was more similar than the last. The reason is that this time rather than just feeding in some numerical settings, I worked at tracking down the reasons for the differences and selected a more “common denominator” set of input parameters. It demonstrates that similar responses are possible, but not likely unless you work at it.
If you need a specific response from one of these devices, have the loudspeaker manufacturer provide a target curve for use in setting up the DSP. Better yet, never attempt to commission a DSP without actual measurements “in situ” with a high resolution acoustic analyzer such as SmaartLiveTM, EASERATM or TEFTM.
Gain structure needs special attention in most of these devices, so read the manual and have a good voltmeter or oscilloscope available. Be sure to test for available headroom at the output of the unit. Some of these devices when operated at “unity” are very near clip.
And finally, if you are using one of the Ethernet units, consider adding an extra Network Interface Card that you can configure for use with the DSP.
DSP brings extraordinary capability to sound reinforcement systems. Learning the strengths and weaknesses of these devices, along with the fundamental concepts common to all of them is the key to their effective use. pb

