“If Bad Sound Were Fatal…” – Systematic Sound System Evaluation
Most listeners can detect “bad sound.” Don Davis famously said “If bad sound were fatal, audio would be the leading cause of death.” What may not be apparent is the reason for the bad sound.
In this article Pat Brown describes his systematic sound system evaluation process. It will reveal any weak links in the signal chain, including the room.
All sound system owners want to know if their system is functioning properly. They receive complaints that suggest there are problems, but they don’t know how to find out. The audio practitioner can provide an objective assessment of the sound system’s working condition. We cannot guarantee “good sound” because that can depend largely on the operator. We can validate that the system is functioning at its full potential.
Here’s the workflow I use to divide, conquer, and provide validation of the system’s performance status. It’s designed to identify problems and provide clues that a deeper investigation should be performed on some part of the system.
Instrumentation for the Systematic Sound System Evaluation
The ear/brain system is our most important evaluation tool, but for this task it must be augmented by electrical and acoustical measurements. Subjective analysis must be confirmed by objective analysis. The client needs more than another opinion on how the system sounds.
There are many measurement platforms that can perform the tests that I describe in this article. For this type of project, I typically use CLIO 12.x™ from Audiomatica – a PC-based measurement platform. This is not an endorsement – I paid for my CLIO rig and I’ve never met them. I use this platform because:
- It includes hardware that is calibrated.
- It has an input stage with switchable sensitivity that maintains calibration while extending the range of voltages that can be measured – anything from mic level to large amplifiers.
- It has balanced IO and phantom power.
- It can perform all the electrical and acoustical tests needed to fully evaluate a system.
- The flexible graphics export capability simplifies documentation.
- It can export each measurement as a WAV file for further processing and listening via convolution.
There are many other software/hardware platforms, but some of these tests aren’t possible or practical using a garden variety USB audio interface. It’s on you to assemble the combination of components required to perform calibrated electrical and acoustical measurements at mic, line, and loudspeaker level.
Step 1 – Listen
The signal chain for a sound system is shown (Figure 1). All sound systems have these stages, realized either discretely or combined into a single product. There is controversy over “which is better” but the discrete approach has a massive advantage when it comes to troubleshooting. I’ll refer to it for the remainder of this article. The evaluation process uses six points-of-observation for data collection.
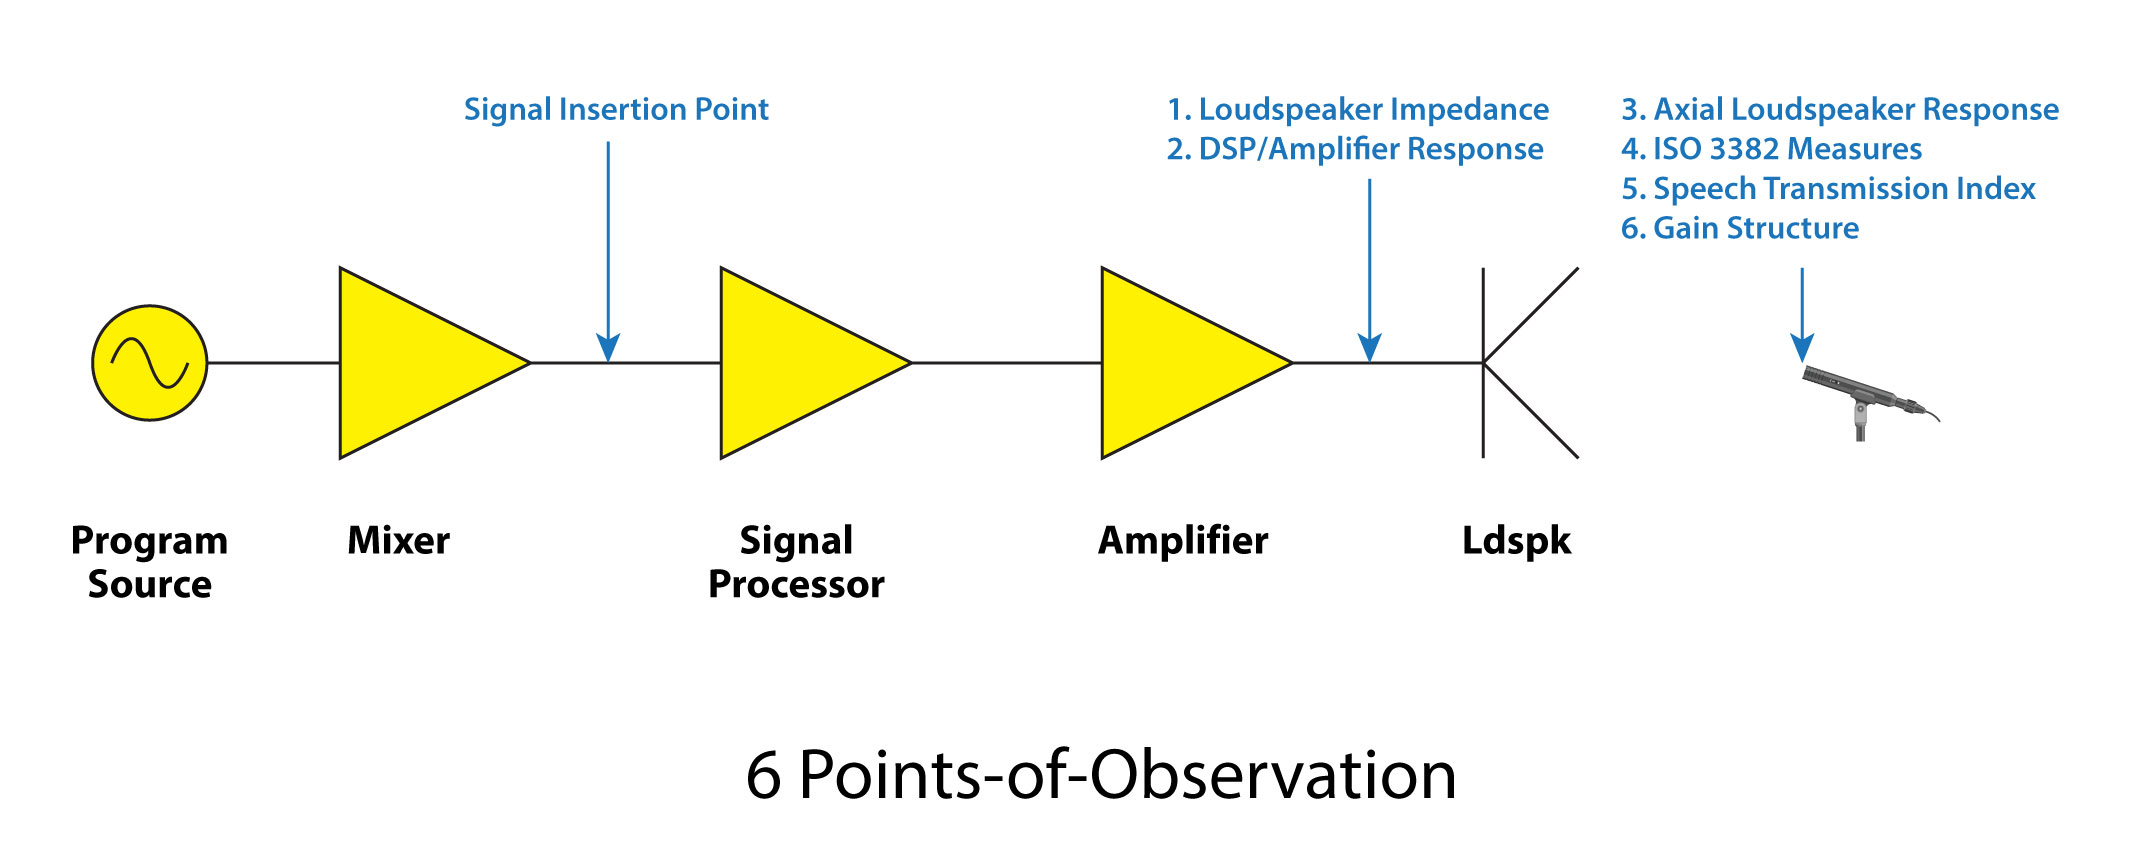
Figure 1 – Inserting the signal post-mixer is the best way to assure that channel effects and open microphones are not influencing the test results.
Always begin with a listening session. Use your own program material and signal source. The NTI MR-Pro™ can play WAV files into any analog input. The CLIO rig can too. I have a collection of reference music and speech tracks. Play a speech track and do a walk through of the venue with the client, notepad in hand. Are there specific complaints? Can you hear them? Your ear-brain system is the most effective initial diagnostic tool. Inject the signal into a flat mixer channel, but better yet inject it post-mixer to remove the mixer from consideration at this time. There are many variables introduced by a mixer that should not be part of a system performance evaluation. It must be neutralized or removed from the signal chain before proceeding.
I’ll use one zone of a 12-zone sound system as an example case in this article – real data from an actual system.
1. Loudspeaker Impedance
I’ll begin at the output of the system and work backwards. I’m behind the amp rack. My first measurement is of the loudspeaker’s electrical impedance. DISCONNECT IT FROM THE AMPLIFIER and connect it to the instrumentation. Use a full range sweep, not a single frequency test (Figure 2). This quantifies the load seen by the amplifier. Is the shape correct? Is the impedance too high or too low? Do multiples of the same make/model match? This test reveals open circuits, short circuits, missing transformers, overloaded amplifiers, staples through wires, and blown tweeters and woofers.
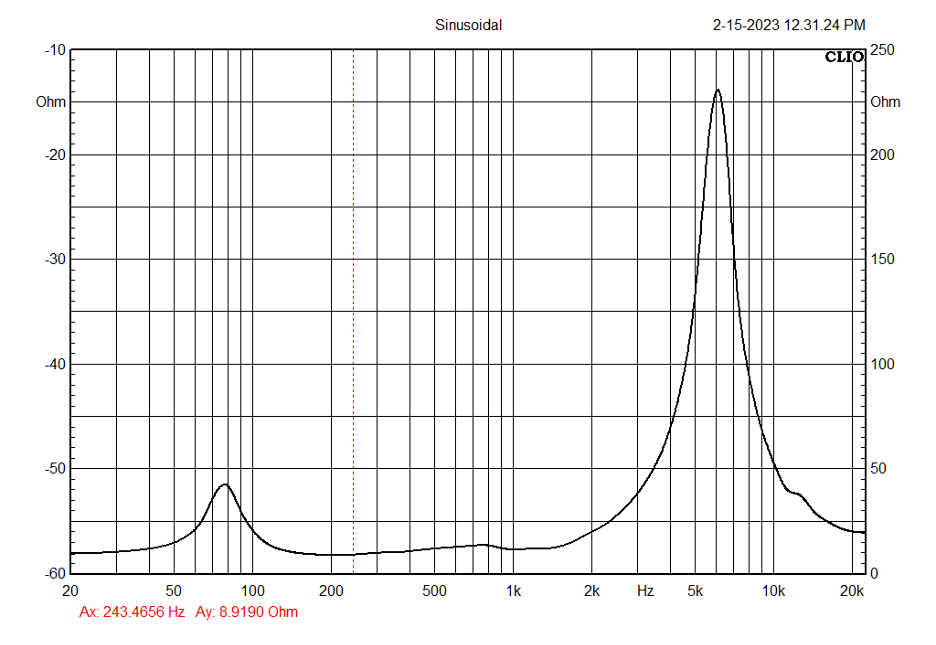
Figure 2 – The impedance plot shows the load that is presented to the amplifier. The cursor is placed at the loudspeaker’s minimum impedance (9 ohms).
Each measurement is stored as a data file, and a graphic of the plot is pasted to a summary word processor document and labelled appropriately. Don’t skip this step. Things can happen to data files, and you’ll appreciate the summary document later. It’s a great place to make notes and it jump starts the final report generation process.
Don’t forget the Hippocratic oath of system troubleshooting – Do no harm! Watch your drive levels. Pay attention to where you connect the probes. Take note of what you disconnect and be sure to reconnect it after the test. If something fails during the evaluation it’s on you.
2. Amplifier Response
The next step is to measure the transfer function of each amplifier. The signal is injected into the post-mixer patch point. This will include the signal processing in the measurement. Switch off any compressor/limiters or use a drive level that does not reach their threshold setting. The analyzer is connected across the amplifier’s output terminals. It is not necessary to disconnect the loudspeaker for this step. Banana plugs and screw terminals make this easy. You’ll need a break-out cable if the amplifier uses Speak-On™ connectors.
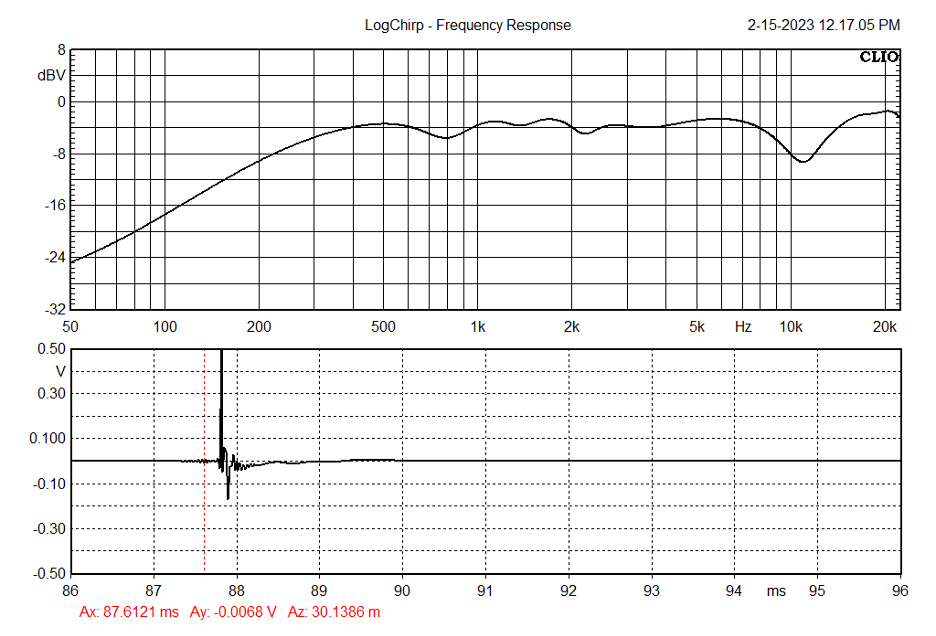
Figure 3 – This measurement at the amplifier’s terminals shows the combined response of the amplifier and signal processing. The EQ curve and delay setting are clearly visible.
With a single test I am checking the amplifier’s gain and observing/documenting the signal processor’s settings (Figure 3). The curve shape shows what is being presented to the loudspeaker. The response will be independent of the drive level until the amplifier reaches clipping or the threshold of a limiter. Stay well below that with your test level. We can drive it harder later if a problem is suspected.
Is it appropriate? Over-equalized? Under-equalized? Distorted? Properly polarized? Appropriately delayed? Is the DSP even doing anything? Measure every amplifier channel and document each as you did with the impedance – both as a saved data file and a graphical capture of the analyzer display.
At this point you may have found some issues in either the loudspeakers, amplifiers, or signal processing. Avoid the temptation to correct them until you have completed the system evaluation.
3. Loudspeaker Response
The next step is to measure the combined response of the signal processing, amplifier, and loudspeaker. There is now an acoustic stage in the signal chain. We are going to collect the room impulse response RIR. A measurement-grade microphone is required. A wireless measurement rig is a big plus.
There are some suggested requisites for the measurements. The RIR (and measurement stimulus) should be long enough to capture the entire room decay, but no shorter than 1.6 seconds. This is an FFT length of 65536 samples at a 48 k sample rate. It’s good housekeeping practice (but not mandatory) to restrict the stimulus length to powers of 2. This can facilitate post-processing on some platforms.
The signal is inserted post-mixer as before. The system is OFF except for the zone being tested. Either switch off the other amplifiers, mute them in the DSP, or disconnect the input signal. The measurement microphone is placed on-axis to the loudspeaker, but well away from the floor plane (Figure 4). I use a 12 ft lighting stand to achieve this placement. The objective is to create a gap in the impulse response between the loudspeaker’s arrival and the first reflections from the environment. This allows the isolation of the loudspeaker’s response using an appropriate time window. If there are reflecting surfaces near the loudspeaker their contribution will be included in the response. This is unfortunate but it is sometimes unavoidable. The placement is what it is. It is usually possible to get anechoic data for at least the mid and high frequency elements.
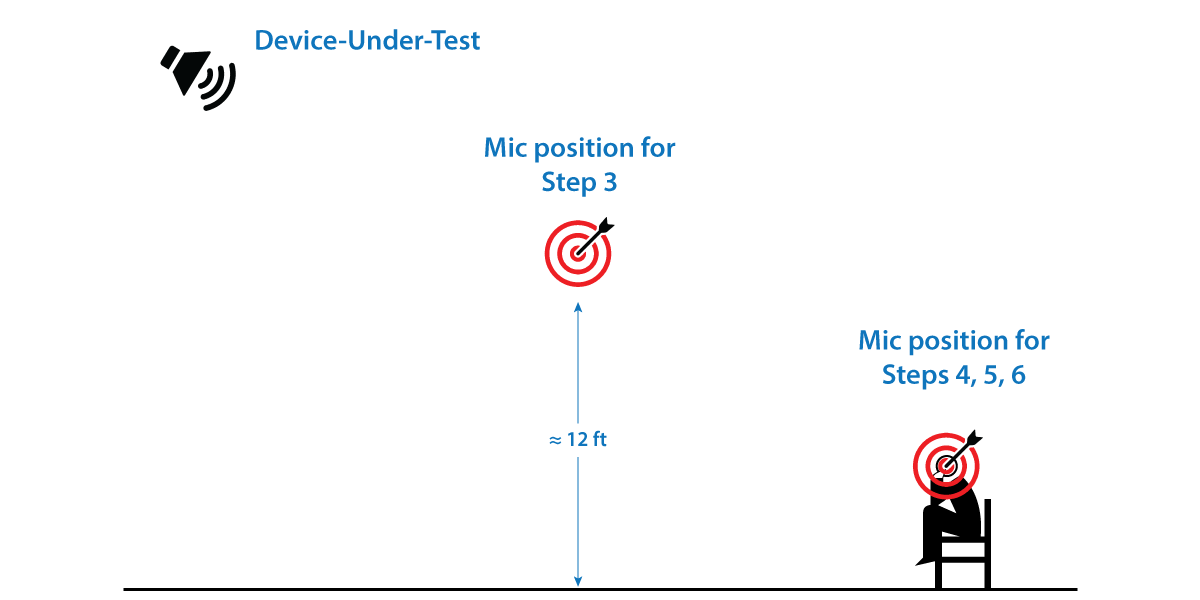 Figure 4 – Measurement microphone positions
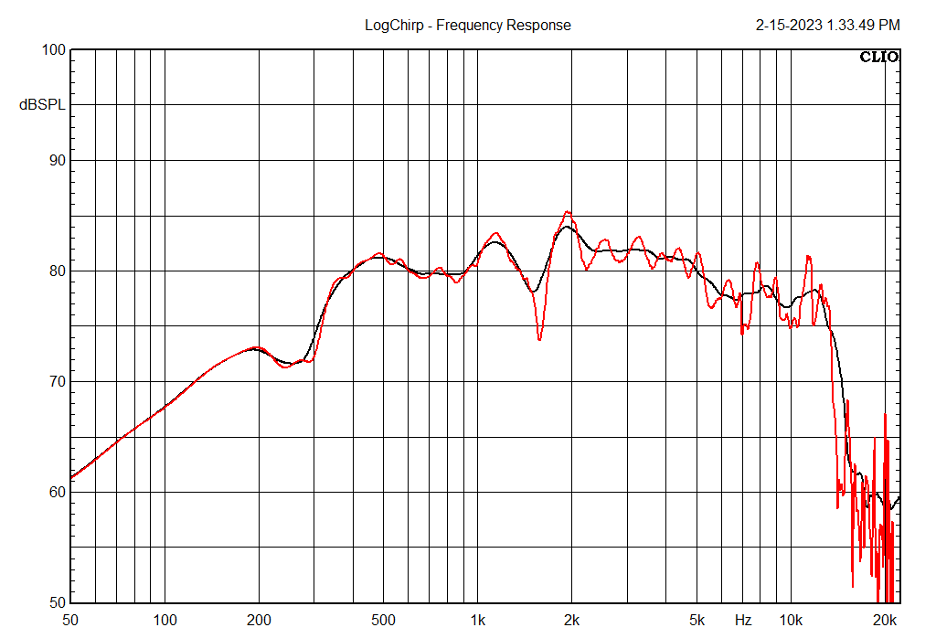
Figure 5 – The anechoic (time windowed) response is shown in red. The 1/3-octave smoothed response is shown in black. The ripple is caused by a ceiling reflection and is not equalizable.
Regarding the response, is it appropriate? Does it make sense considering the amplifier’s response curve? Is the polarity correct? Did you hear any buzzes, rattles, or spurious harmonics during the sweep? Document the results with a saved data file and graphics capture (Figure 5). Our summary document is growing!
4. The Room Response
Until now we have ignored the room’s contribution to the sound of the system. Our data set is for the post-mixer system only, except for some early reflections around the loudspeakers. Any major issues should be apparent by now. Next, let’s include the room.
For the remaining tests the entire system will be operating as it is used in the venue. All appropriate zones are “on.” I am going to capture the room impulse response RIR at ear height at each previously tested positions – on-axis with each source (Figure 4). The same microphone can be used. Another option is to collect a multi-channel response using an Ambisonic™ technique. This data will yield the omnidirectional response needed for some acoustic measures but also additional microphone patterns for listening to the room.
The RIR is post-processed into the Envelope Time Curve ETC for analysis (Figure 6).
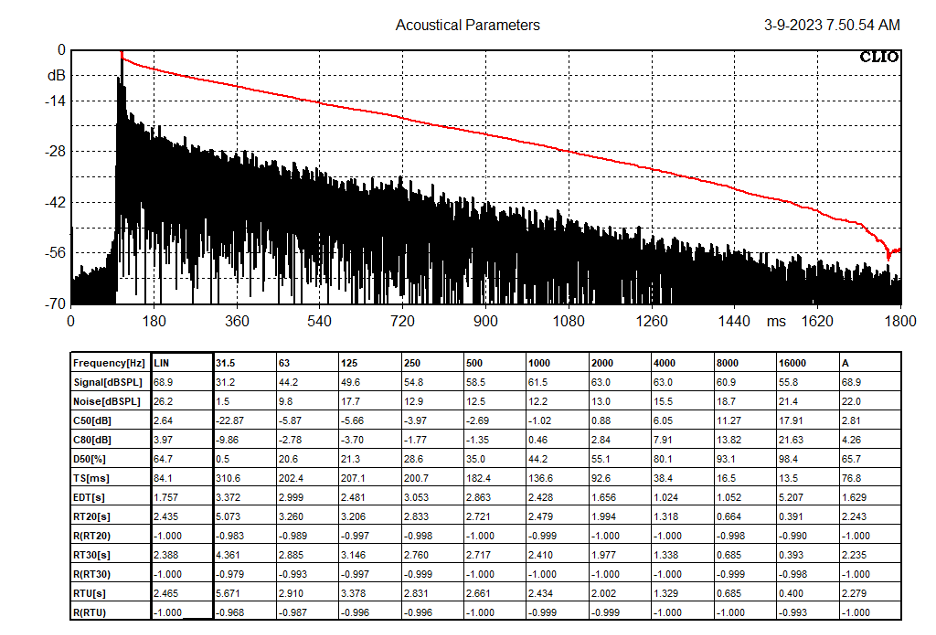
Figure 6 – The ETC is used to determine energy decay times and energy ratios at the listener position. The table gives the ISO 3382 measures for this seat.
This step yields three important pieces of information – the system response, the ISO 3382 room measures, and the Speech Transmission Index STI. The ISO measures include the reverberation time, early-decay time, and clarity score.
5. The Speech Transmission Index STI
As much as I hate them, the market likes “one number” ratings. The STI provides this for the speech intelligibility (Figure 7). It will reveal information on the system’s performance in each zone. The STI is not a sound quality score. It reveals how information emitted from the system is masked by noise and/or reverberation and how they affect the speech intelligibility. Sound quality is assessed subjectively by listening. Sound clarity and speech intelligibility are evaluated by both listening and measuring.
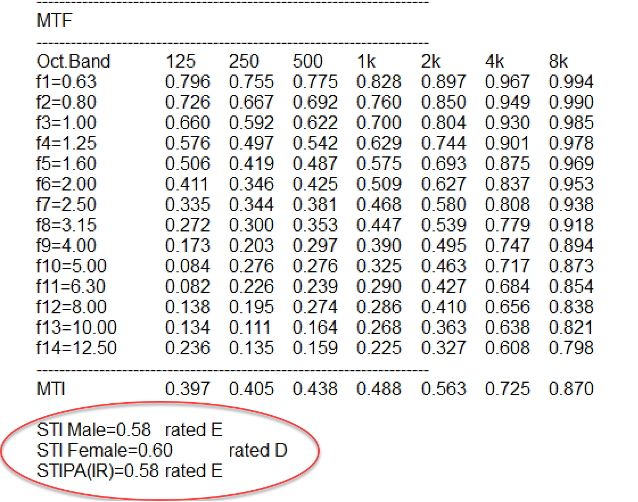
Figure 7 – The RIR can be post-processed to yield the Speech Transmission Index.
6. Gain Structure
The workflow describe gives a base-line data set for the system’s performance. A final step is to examine the system’s gain structure to determine if changes might be beneficial. I’ll need to feed a pink noise stimulus into the system from the signal generator. This analog signal can be converted to digital, Dante, or whatever with an appropriate bridge. The general objective is for the system to produce its target SPL with about 1 VRMS at the mixer’s output. This is the typical line level output of an analog mixer and about -20 dBFS for a digital mixer.
An appropriate target SPL must be determined. 85 dBA-Slow is a good placed to start. Some systems must go louder, and yet others lower – make a decision based on the system you are testing.
The use of a calibrated signal source makes the job easy. The MR-Pro can play pink noise at a specified electrical level. So can the CLIO system, albeit one must factor in the crest factor of the program material. The RMS level of the noise will be lower than the output level indicated by the GUI. Fortunately CLIO can measure itself via the loop back setting to find the actual signal level.
Place the measurement mic on-axis with one of the main floor loudspeakers you have previously measured (Figure 4). Select pink noise as the program source, and set the generator level to a very low value (e.g. -30 dBV). Start the noise and observe the SPL on the sound level meter. How far are you below the target SPL? Ideally you should be about 30 dB low, since that is the level difference between the initial signal level (-30 dBV) and target drive level of 1 VRMS (0 dBV). Advance the level slowly and watch the SLM. Can you reach the target SPL? You should be able to easily tell if you will be over or under well before you reach 0 dBV. If over, there’s too much gain post mixer (Wrong amplifier attenuator setting? Amplifier gain switch in wrong position?). Figure 7 shows the gain adjustments available post-mixer. If you reach 0 dBV and are below the target SPL, there is not enough gain post-mixer (Wrong amplifier attenuator setting? Amplifier gain switch in wrong position? Undersized-amplifier?). Remember, this is audio. Close is good enough.
Make notes about these results, not changes to the system. There can be severe ramifications from making gain structure changes to complex systems.
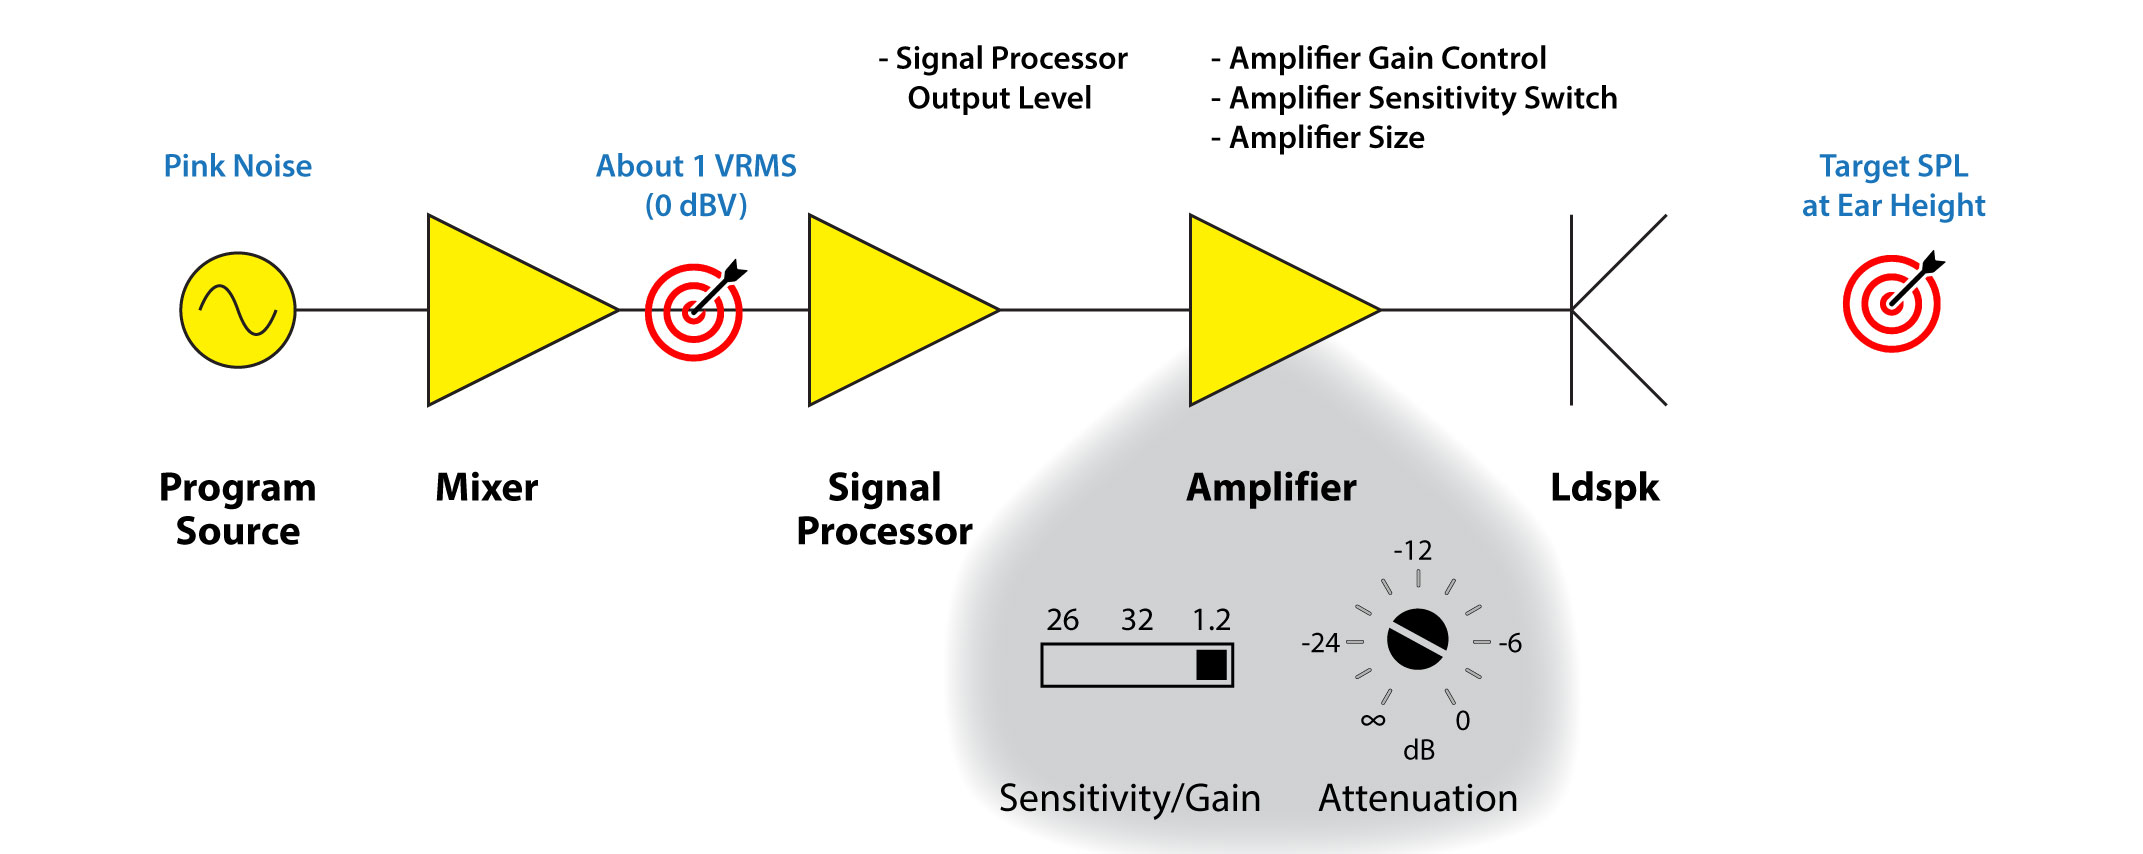
Figure 7 – Gain structure objectives based on drive level and target SPL. The post-mixer variables in play are shown.
Wrapping Things Up
This process intentionally ignored the mixer’s contribution to the response due to the high number of potential variables. A final step is to listen through the mixer to identify any anomalous contributions it might make to the system response. It can be measured if necessary. The venue’s microphone selections and placements should also be reviewed. I divided the signal chain where I did (post-mixer) because everything after this point tends to be fixated. Everything before it tends to be variable.
There is much more that we can do with the data. I can listen to any of the acoustic measurements using convolution using GratisVolver™. It is quite revealing to compare the isolated response of each component (tall mic stand) to the system response (ear-height with entire system on). This can aid in identifying sound quality and speech intelligibility issues. At this point you can decide if additional measurement positions are necessary. Specific, in depth measurements of any system component can be performed if indicated by this data set.
The summary report should identify any problems found and include some suggestions for improving the system’s response, either by replacement, re-tuning, or re-design. pb

