Divide and Conquer – The Schroeder Frequency
by Pat Brown
Not all sound energy in a room is reverberation. The Schroeder frequency divides the spectrum based on sound wave behavior.
It has been understood for centuries that the behavior of sound waves indoors is frequency-dependent. The room energy tends to “die out” at high frequency and “resonate” at low frequency. Audio practitioners must deal with both. This article examines the distinction between these two behaviors.
Reverberation Time – RT
The room reverberation time (RT) has emerged as the dominant measure of a room’s acoustic behavior for many practitioners. This is probably due to the availability of relatively simple tools for estimating and measuring it. The RT basically describes the sound “persistence” in a space after the cessation of a steady-state sound source (Figure 1). The decay is timed for 60 dB, and the RT is given in seconds. It is frequency-dependent and usually measured in 1/1-octave bands.
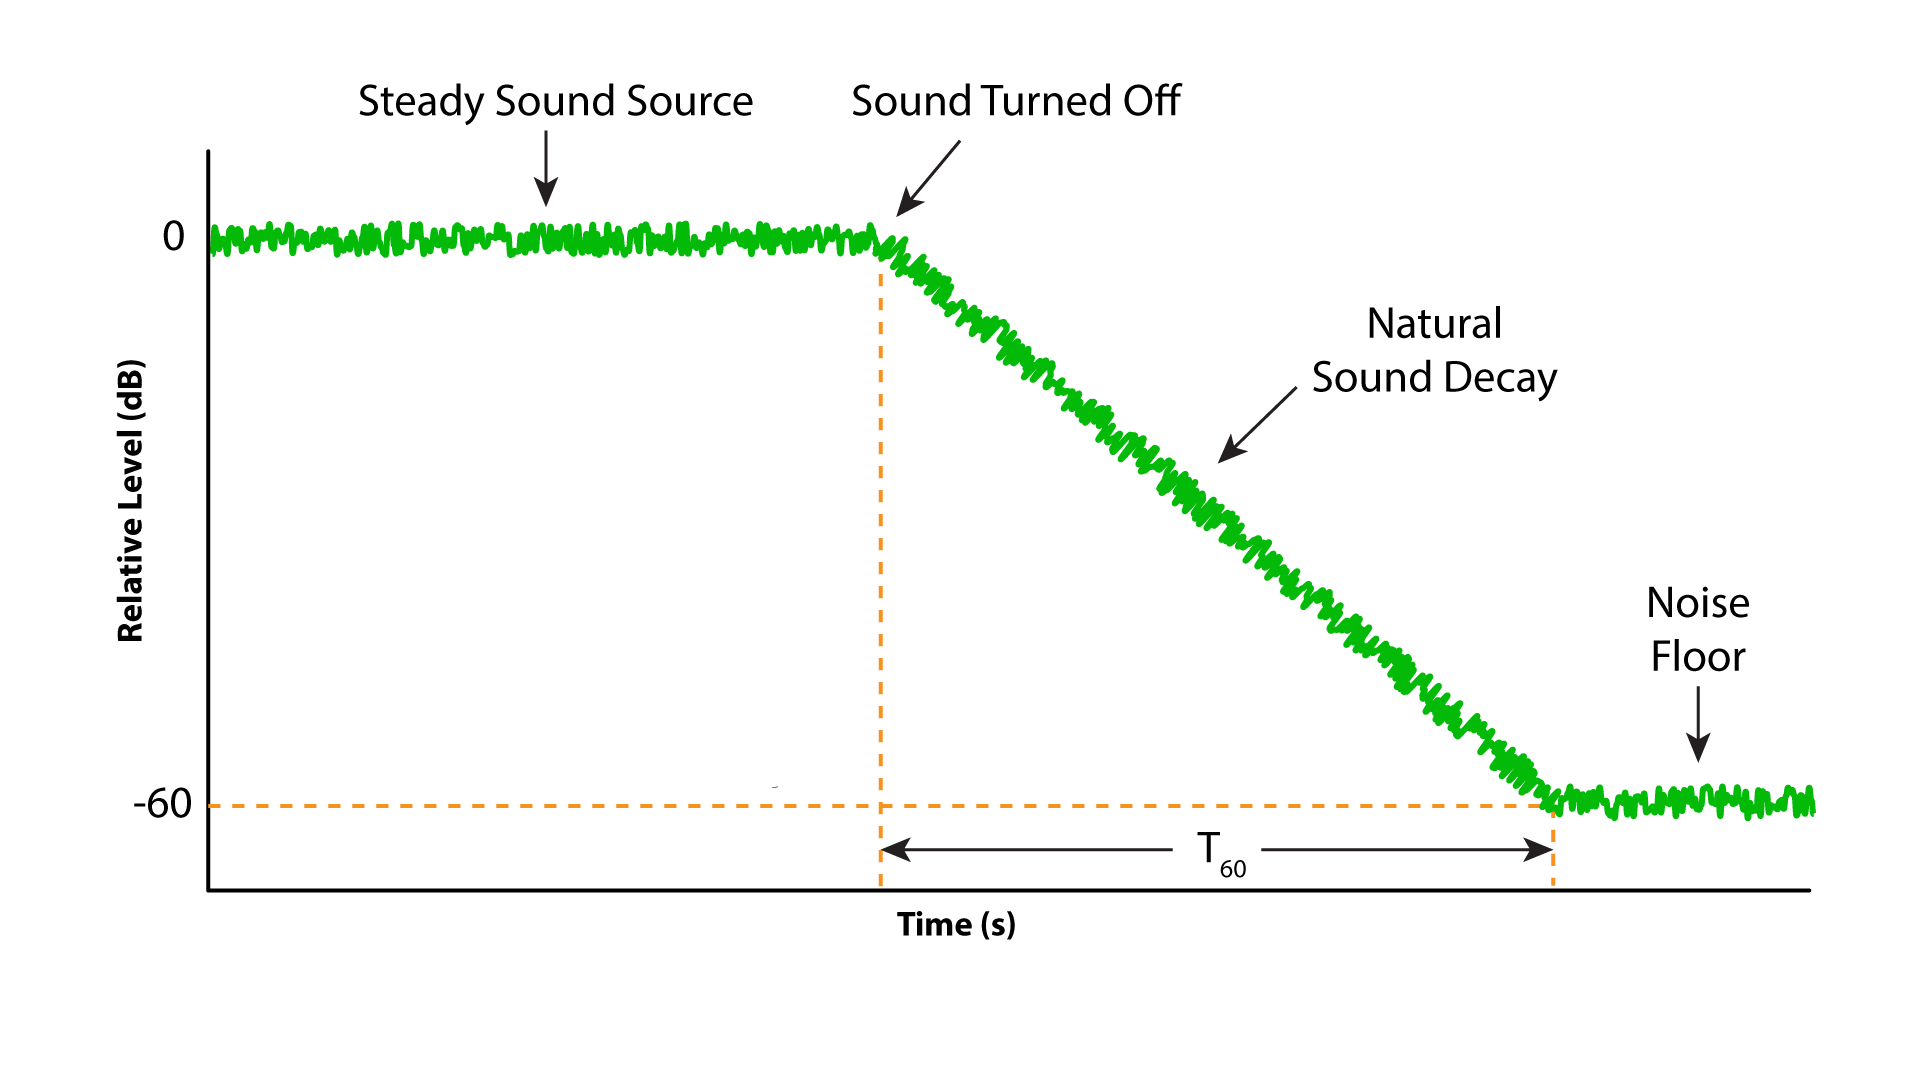 Figure 1 – The reverberation time (RT) is a measure of the persistence of sound in a space. Reverberation is a diffuse field that produces approximately the same RT for any position in the room.
Not all reflected sound energy is reverberation. A reverberant field requires time to develop. The sound must reflect around the room enough to produce a uniform diffuse field. This is most likely to happen in large spaces with little or no sound absorption. As the room size shrinks, and/or the sound absorption increases, the likelihood of the presence of a significant reverberant field diminishes. There will still be reflected energy present, but it may not meet the classical definition of reverberation, and it may elude prediction with classical reverberation formulas.
Frequency-Dependent Sound Behavior
The wavelength (λ) of sound increases with decreasing frequency (Figure 2). When the wavelength “agrees” with the spacing between room surfaces, standing waves occur. These “room modes” or resonances are normal and occur in all enclosed spaces. Modes are the dominant “acoustic events of interest” regarding the low frequency performance of a sound system.

Figure 2 – The size of a sound wave relative to the room’s volume has a profound effect on its behavior. Note that at LF the wavelength size approaches the internal dimensions of many rooms.
The sound in a large, hard space will tend to be “mode-dominated” at low frequencies (long wavelengths) and “diffuse field-dominated” at high frequencies (short wavelengths). As such, the RT may have no real meaning in many (most) rooms at low frequencies.
A reverberant field is uniform throughout the space. Room modes produce huge pressure differentials across a space (Figure 3). And as is always true with acoustics, there is a transition region between the two behaviors. We have different tools for working with each, so it is important to make the distinction.
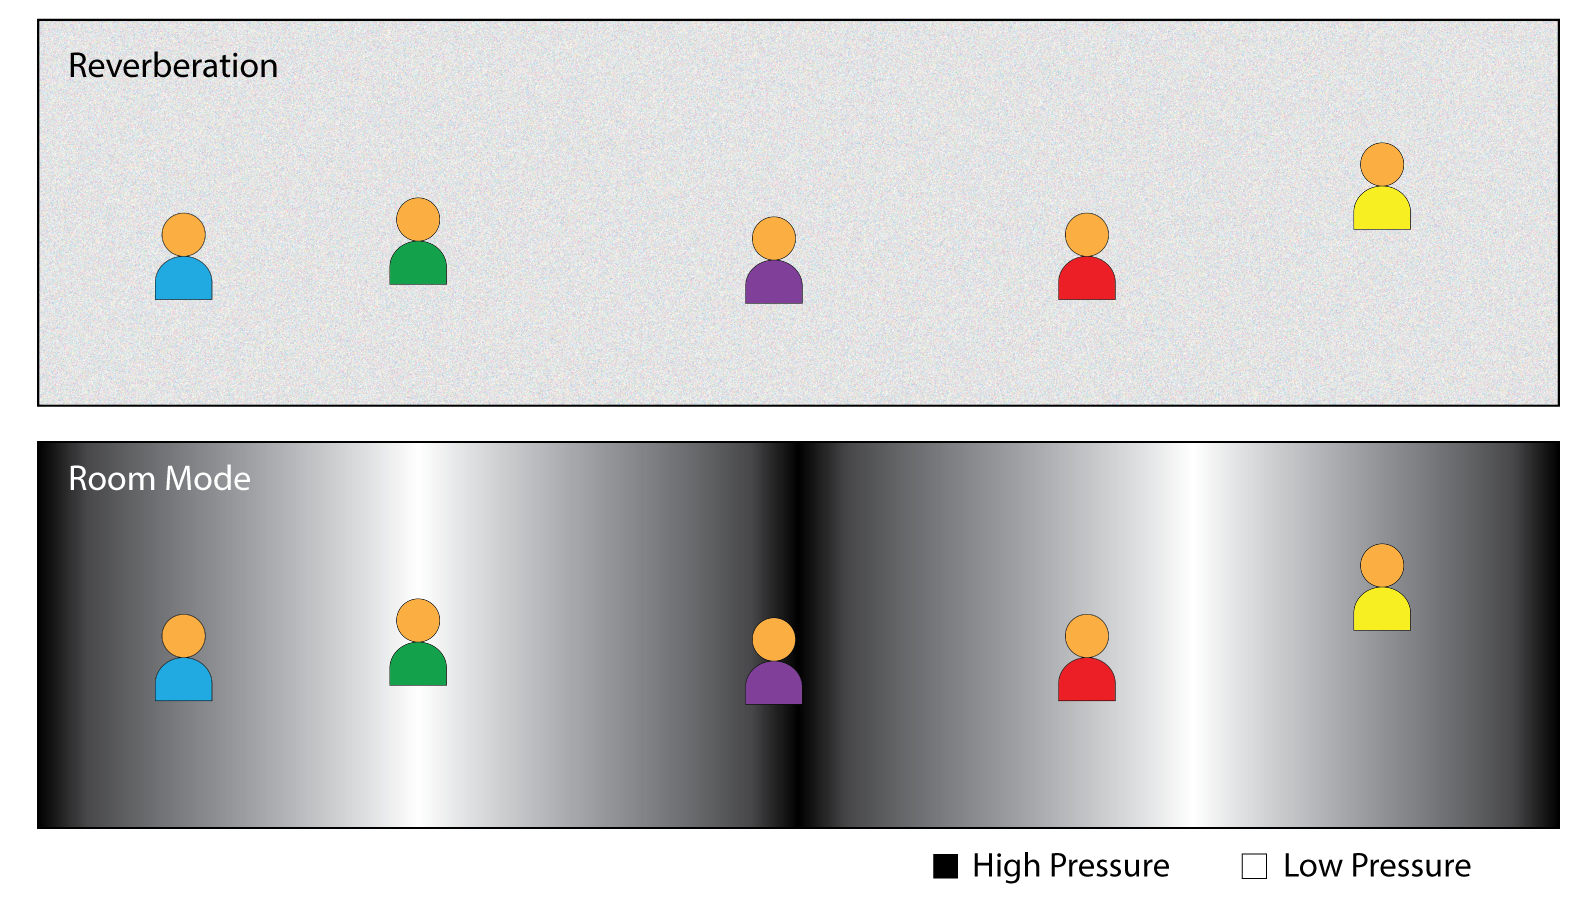
Figure 3 – Reverberation produces the same sound level for all listeners. A room mode produces dramatic level changes from seat-to-seat.
The Schroeder Frequency
Manfred Schroeder developed a formula for identifying the transition frequency between modal (small room) and diffuse (large room) behavior. It can be determined from the RT by calculation (Figure 4). Once known, the Schroeder frequency FS can be used to divide the room into approximate frequency regions or zones, with each having a distinct acoustic behavior.
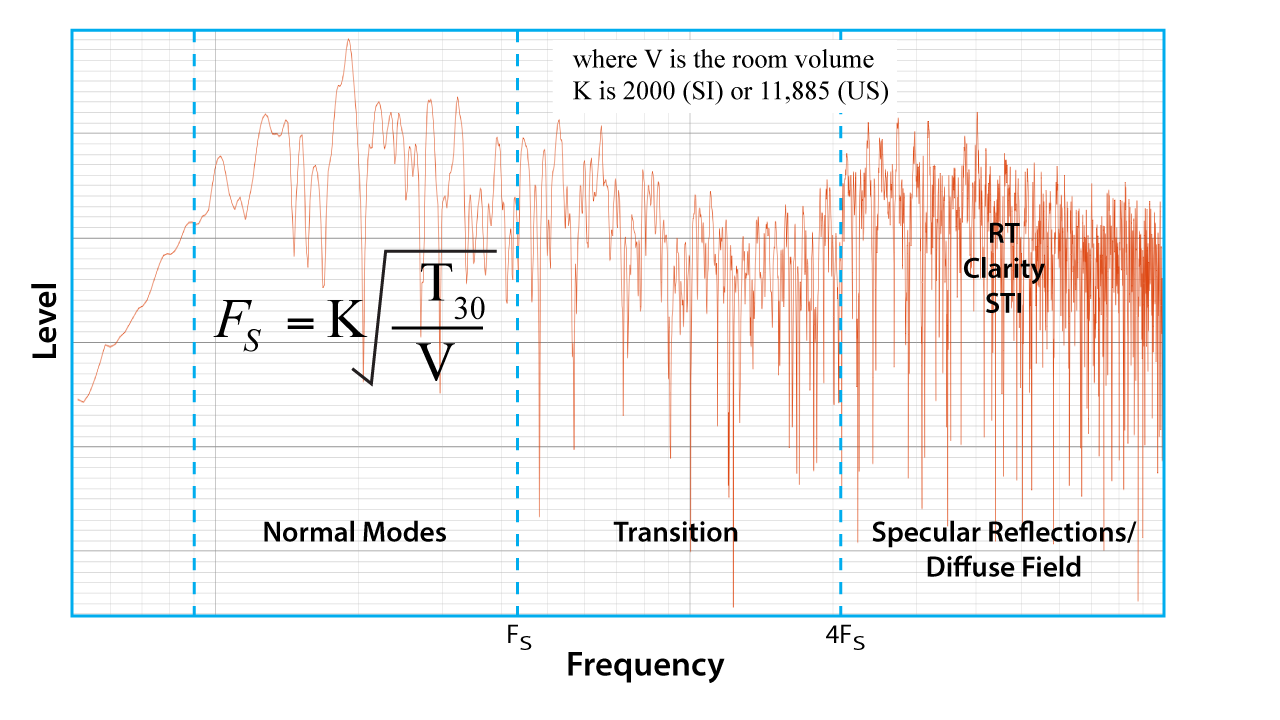 Figure 4 – All rooms have modes at low frequencies. The modal density increases with frequency. Modes may be considered independently below FS and collectively above FS.
Acoustic measures such as RT, Early-Decay Time (EDT), Clarity (e.g. C50), and the Speech Transmission Index (STI) apply mainly above FS. Room modes are dominant below FS and are easily measured and somewhat predictable.
An Example Room
As an aid in presenting these concepts I will use a moderate-sized auditorium. This is an actual space that can be measured and listened to (Figure 5). The room’s internal volume is approximately 100,000 ft3 (2900 m3). According to the Sabine equation for RT there are approximately 1700 English Sabins (163 SI) in the space in the MF decade given that the measured RT is about 3 sec (Table in Fig. 7).
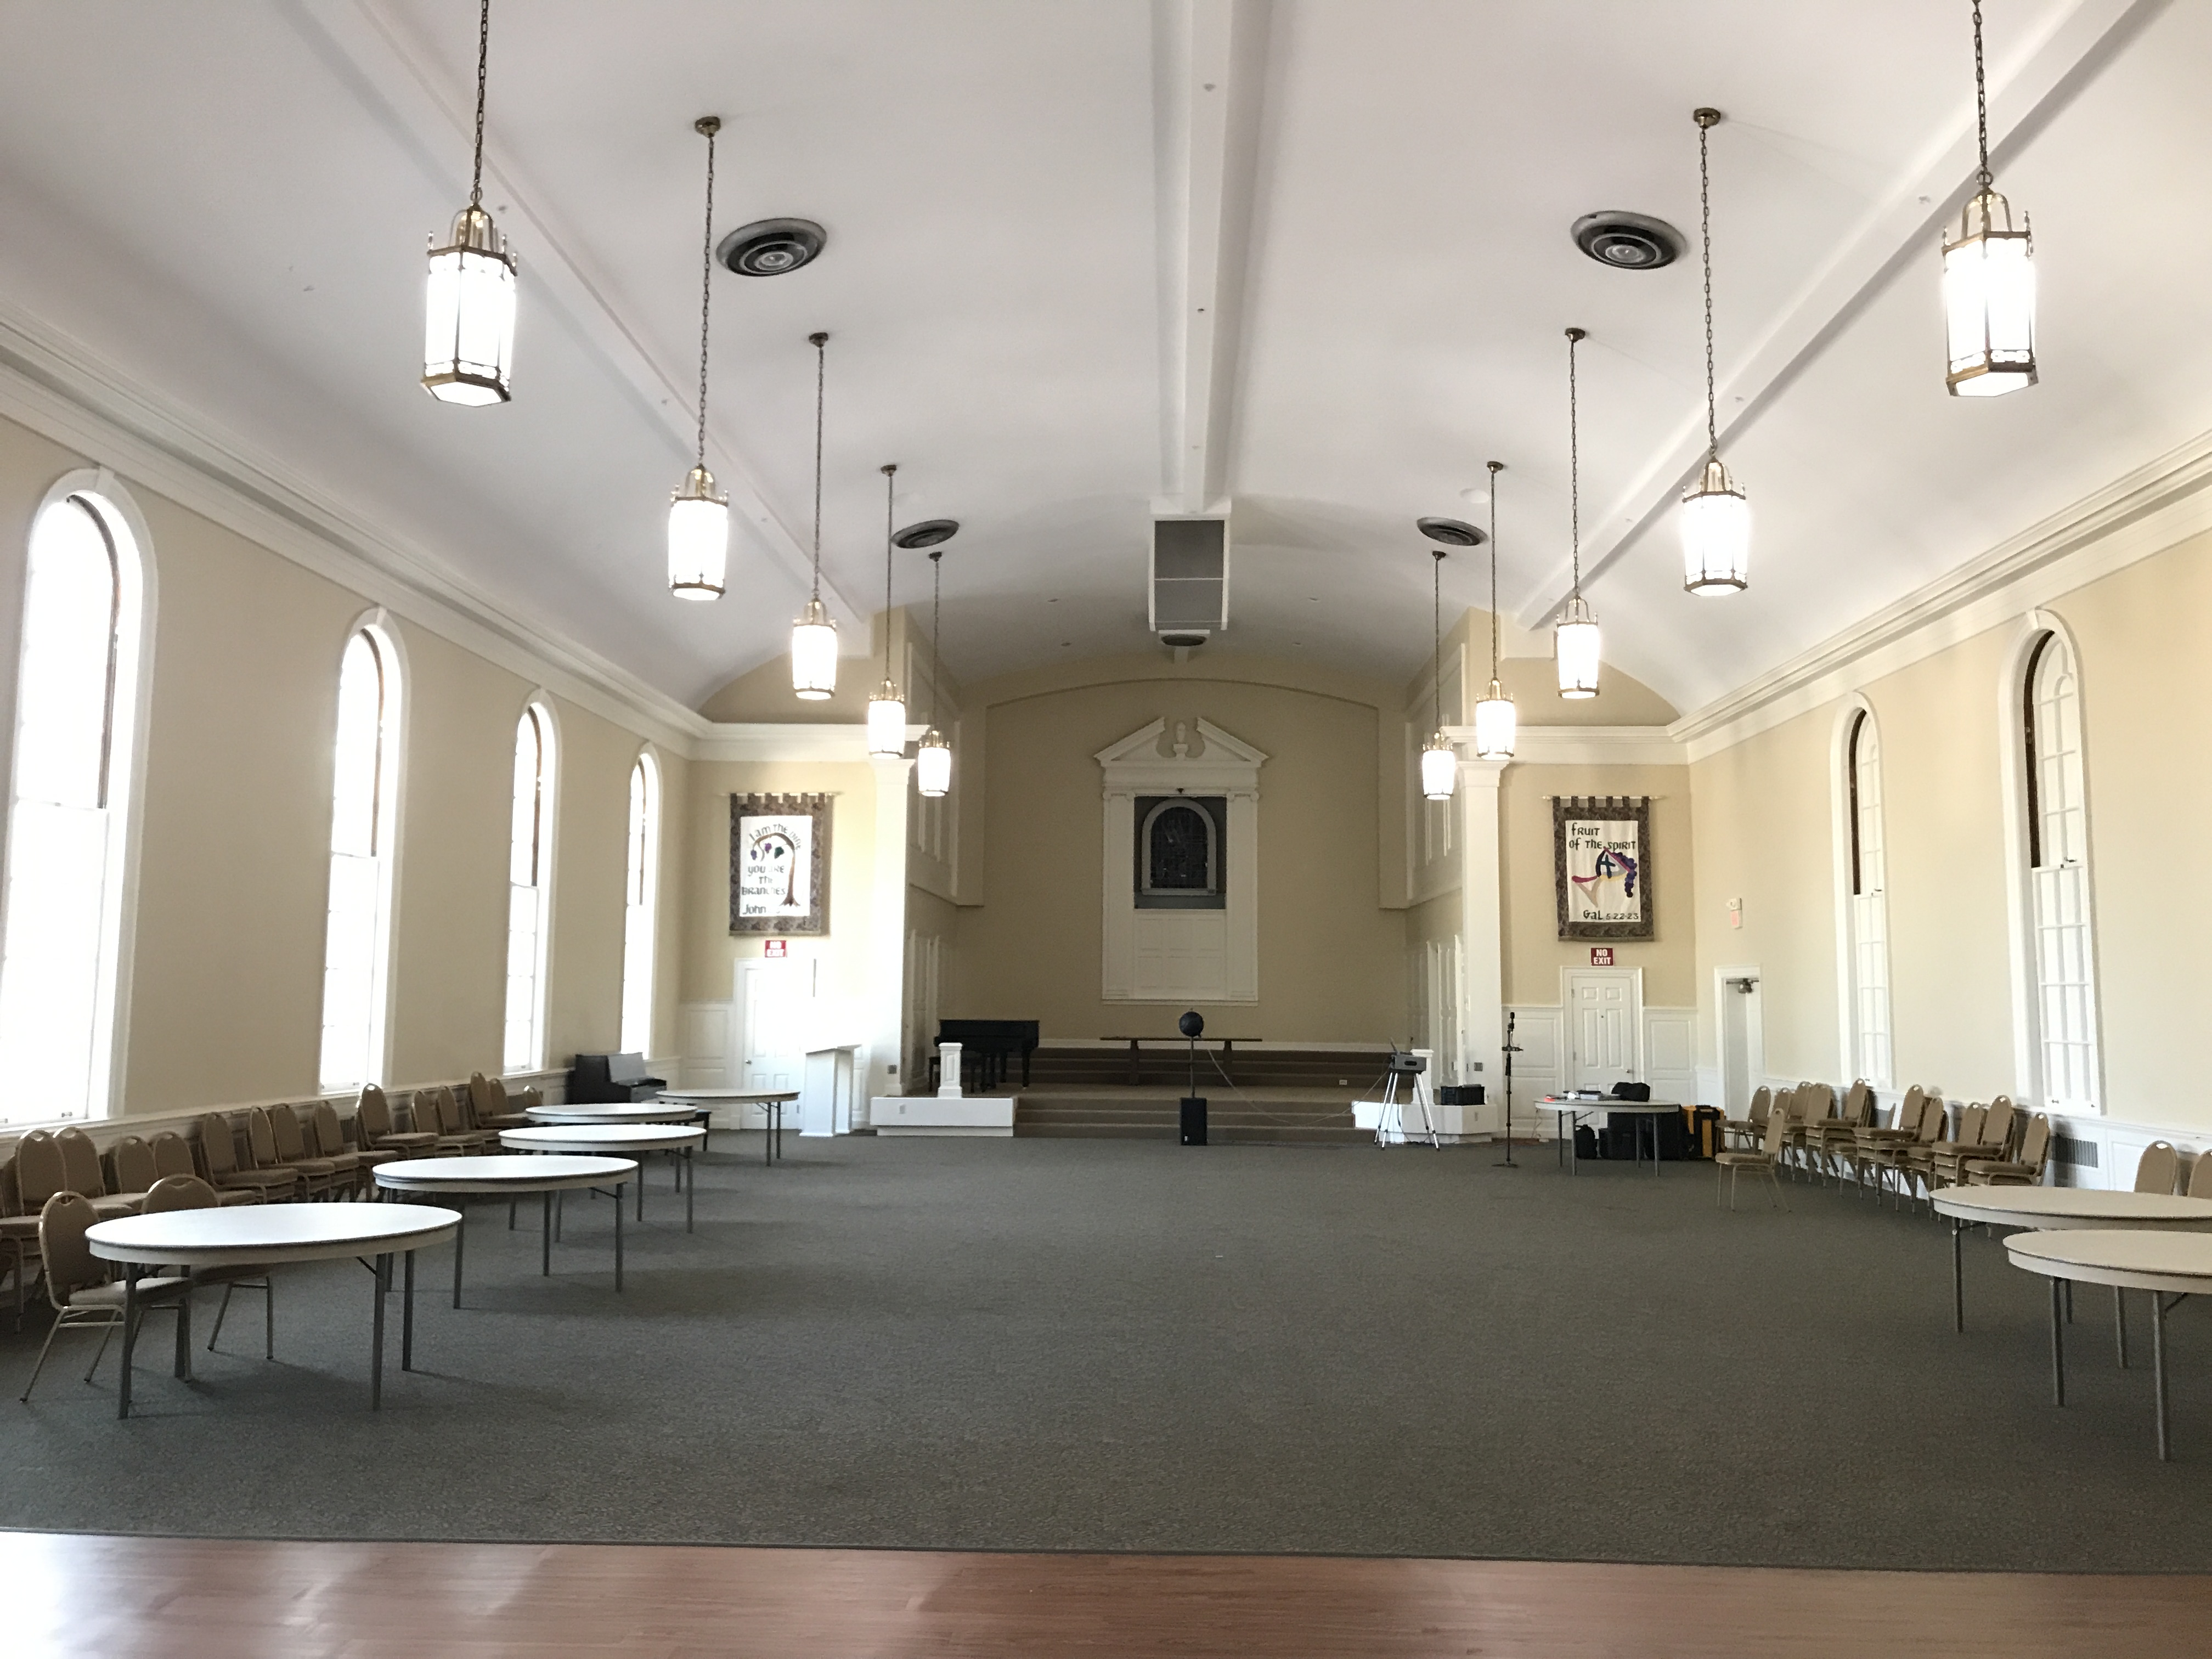
Figure 5 – This room exhibits significant modal and reverberant behavior. Smaller rooms tend to be more mode-dominated and larger rooms more reverberation-dominated. The sound source can be seen just in front of the stage.
The room impulse response (RIR) characterizes the room’s response to a burst of sound energy. It is collected by stimulating the room with a sound source at unique point in space and collecting the response at a different unique point in space. The RIR is the room’s acoustic signature that will be placed on any other sound that emanates from the source loudspeaker. It includes all acoustic events of interest, including specular reflections, reverberation, and room modes. By collecting several RIRs you can get a pretty good feel for the room’s behavior, be it good or bad.
The RIR of an omnidirectional sound source was gathered at 3 test positions using an omnidirectional microphone (Figure 6). Note that the distances are log-spaced.
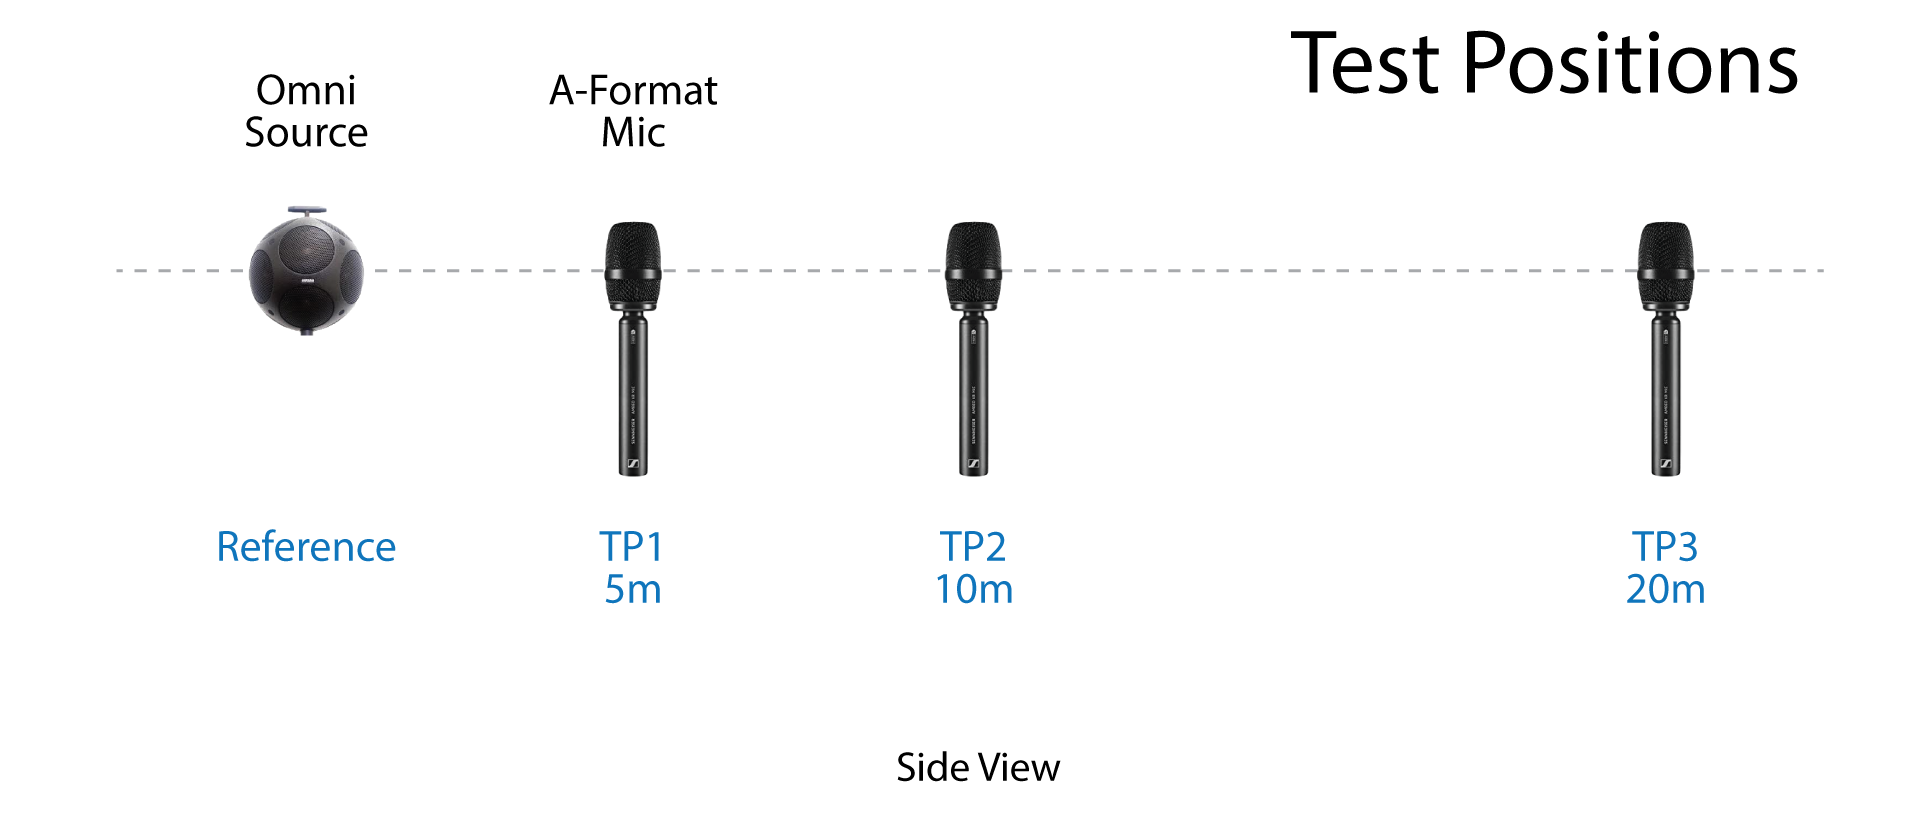
Figure 6 – The three test positions are down the room’s center line, toward the camera (Figure 5). The microphone is A-Format and the RIRs are B-Format.
Once collected, the RIR can be post-processed to produce the previously mentioned acoustic measures (Figure 7). It can also be listened to by convolution. Let’s have a listen.
↑ Speech at TP1
↑ Speech at TP2
↑ Speech at TP3
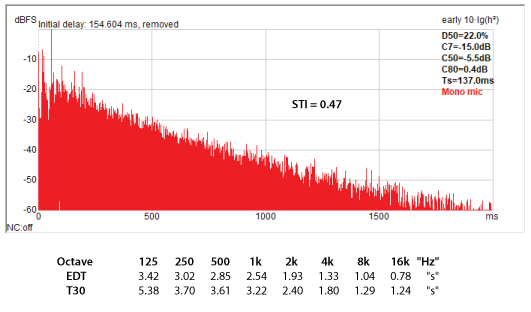
Figure 7 – The very strong direct arrival and early reflections become reverberation over time as the reflection and modal density increase. Note that the 125 Hz RT is 5.4 sec, but since this is well below 4FS it is not reverberation. Plot and measures courtesy ReflPhinder.
Viewing the RIR in the time domain (usually as an ETC) is the best way to identify the presence of reverberation. The characteristic signature is a smooth decay beyond a few hundred milliseconds (Figure 8) which extends into the noise floor. With software we can pick a section of this decay and extrapolate it to 60 dB to get the RT. This process is automated by most measurement programs.
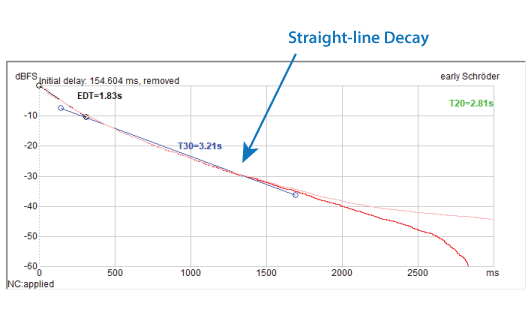
Figure 8 – The straight-line decay of the Schroeder integrated RIR is a defining characteristic of reverberation.
Specular reflections can also be identified on the same plot, usually by zooming in and examining the high-level arrivals that occur prior to the sound becoming diffuse (Figure 9). Specular reflections can wreak havoc on the sound, but they are not reverberation. A surface that produces a high-level specular reflection for multiple seats can be treated or reshaped.
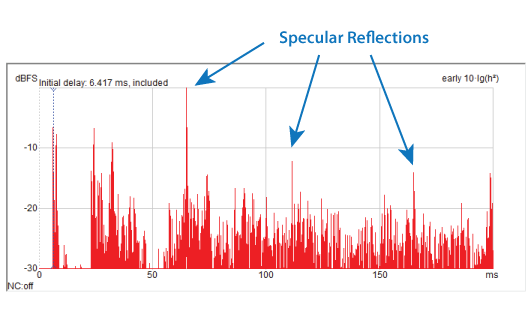
Figure 9 – Early-order reflections have a “light-like” geometric trajectory en route to the listener. Reverberation has no specific direction of energy flow. It is a diffuse field.
The time domain is essentially blind to room modes. By applying the FFT and moving to the frequency domain the modal frequencies will be apparent (Figure 10). In the frequency domain we can use FS to divide the room into acoustic zones.
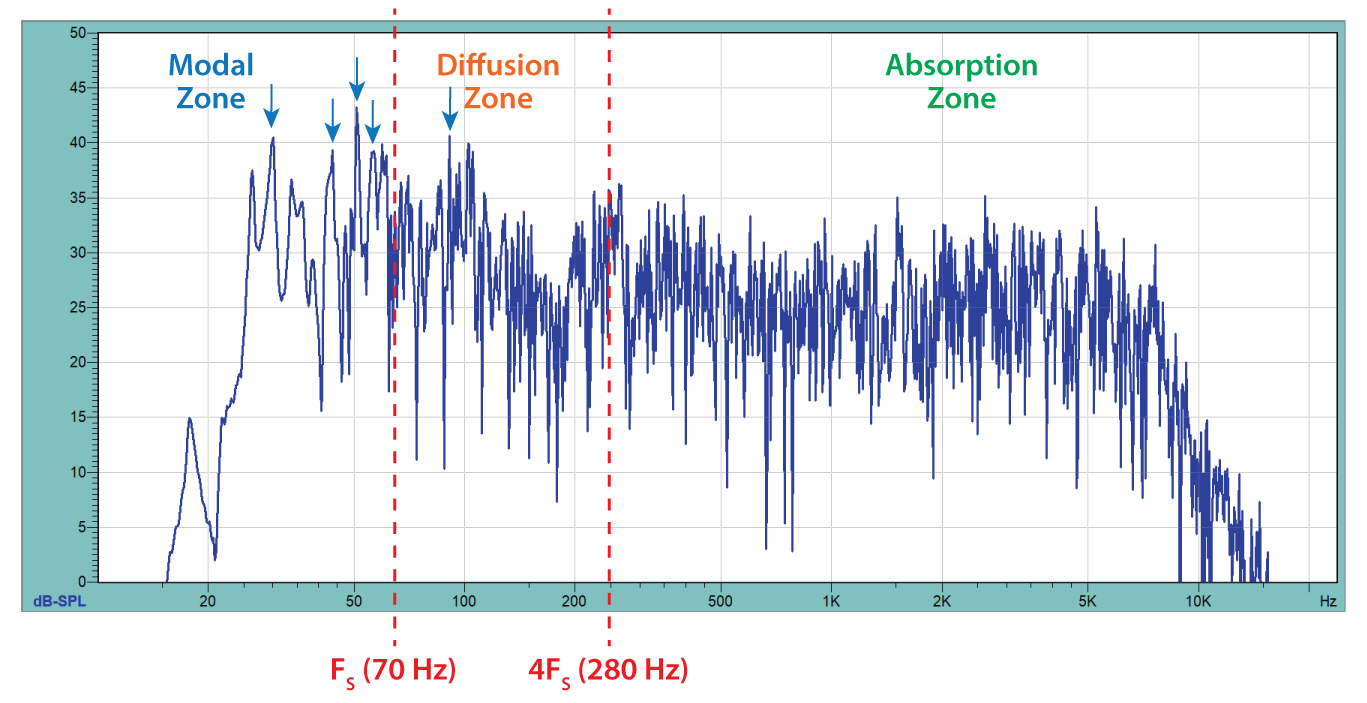
Figure 10 – A very long time window is required to resolve room modes (arrows). The low modal density below FS is what makes modes audible (and bothersome). A subwoofer was required to excite the modes in the example room. This is the frequency response magnitude of an RIR produced by aligning, nomalizing, and summing the RIRs of the three test positions. Plot courtesy RoomCapture.
The Frequency-Time-Curve FTC allows visualization of the room modes using both the time and frequency domains. Resolution is sacrificed in each to view both simultaneously. Figure 11 clearly shows the low modal density below FS with increasing modal density with increasing frequency. Well above FS the modes are so dense that they cannot be addressed individually.
The FTC allows visualization of the modal behavior of a room, specifically the individual modal frequencies and the modal density as a function of frequency. Imagine how Schroeder could have used this plot when developing his equation for FS!
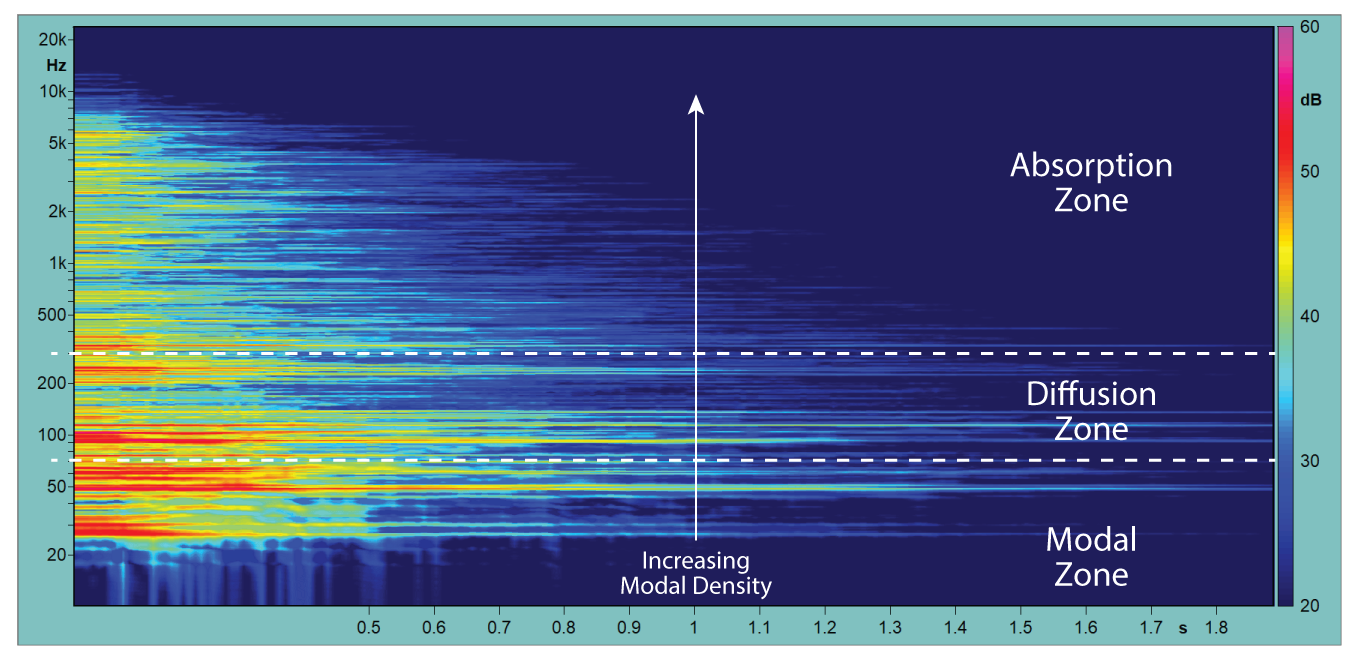
Figure 11 – The FTC is a 2D view of a waterfall plot. Since a given anti-node may or may not be present at a specific position, all three test positions were combined to produce the plot shown. Plot courtesy RoomCapture.
Why We Care
A major reason for considering FS is that it identifies the appropriate surface treatment for taming the room’s response. A major decision when specifying acoustical treatment is the thickness of the material. At 1/4-wavelength a porous absorber is very effective – less so with decreasing frequency. Figure 12 shows a comparison of the approximate absorption of acoustic panels of varying thickness. Note the increase in absorption with panel thickness.
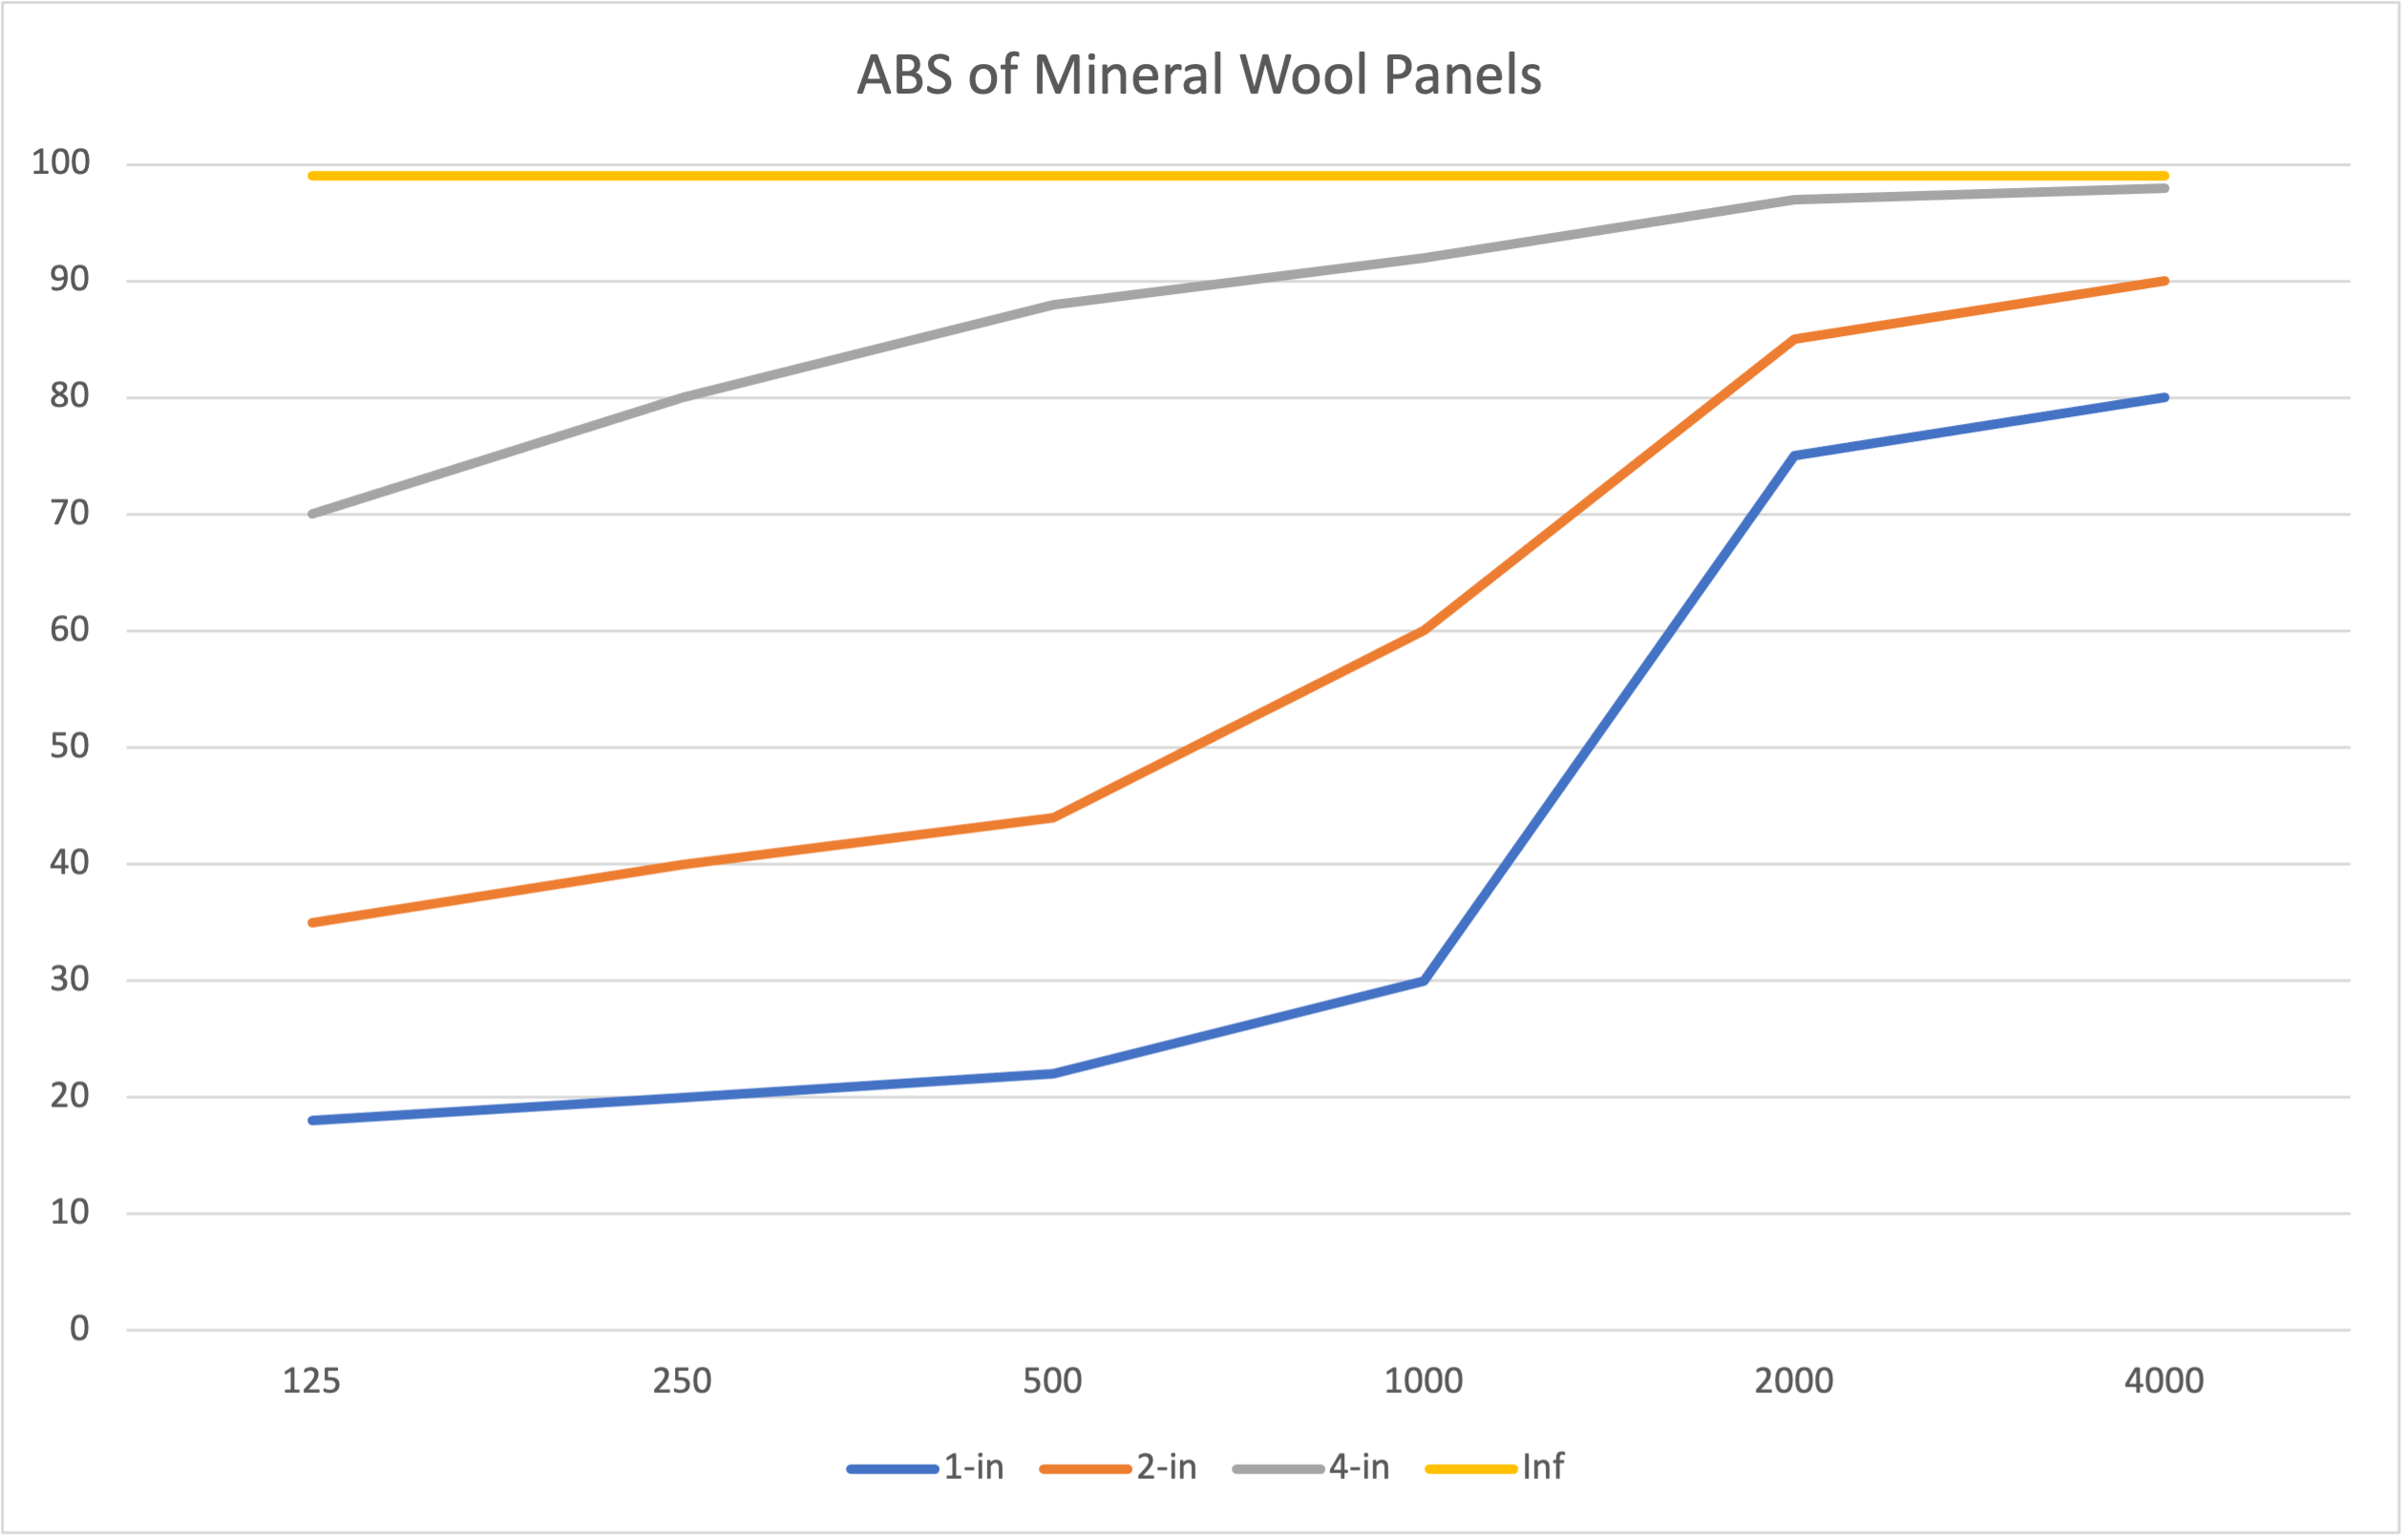
Figure 12 – These are conservative estimates of the alpha values for flat panels. In practice the alphas can be higher due to wave-related phenomenon.
At 4FS and above, carpet, mineral wool panels, and people are very effective for reducing an excessive RT. If scattering is desired instead of absorption, the scattering surface can be have shallow relief features. In either case, 1/4 λ serves as a guideline for the minimum absorber thickness or scatterer depth.
As we move lower into the diffusion zone the required depth and breadth of the absorption increases. In this frequency region it may be more beneficial to break-up the sound waves rather than absorb them. This can be accomplished by wall shape, furniture, or complex surfaces with deep relief.
Below FS we have entered the realm of active absorbers such as diaphragmatic panels, bass traps, Helmholtz radiators, etc. Tunable active bass traps can be effective in small rooms. When treatment is not possible, notch filters can be used to reduce the excitation of annoying resonances.
The thin absorbers that work well in the absorption zone look like tissue paper to bass frequencies.
Non-Reverberant Spaces
Not all rooms develop a significant reverberant sound field, yet all rooms develop modes. An alternative FS formula considers the room’s smallest dimension, reasoning that it will determine the frequency of nodes near the upper limit of the modal zone. This simpler formula for critical frequency (FC) can be used in small spaces like studios, conference rooms, and even automobiles (Figure 13). FC and FS are essentially the same thing, but with different origins.
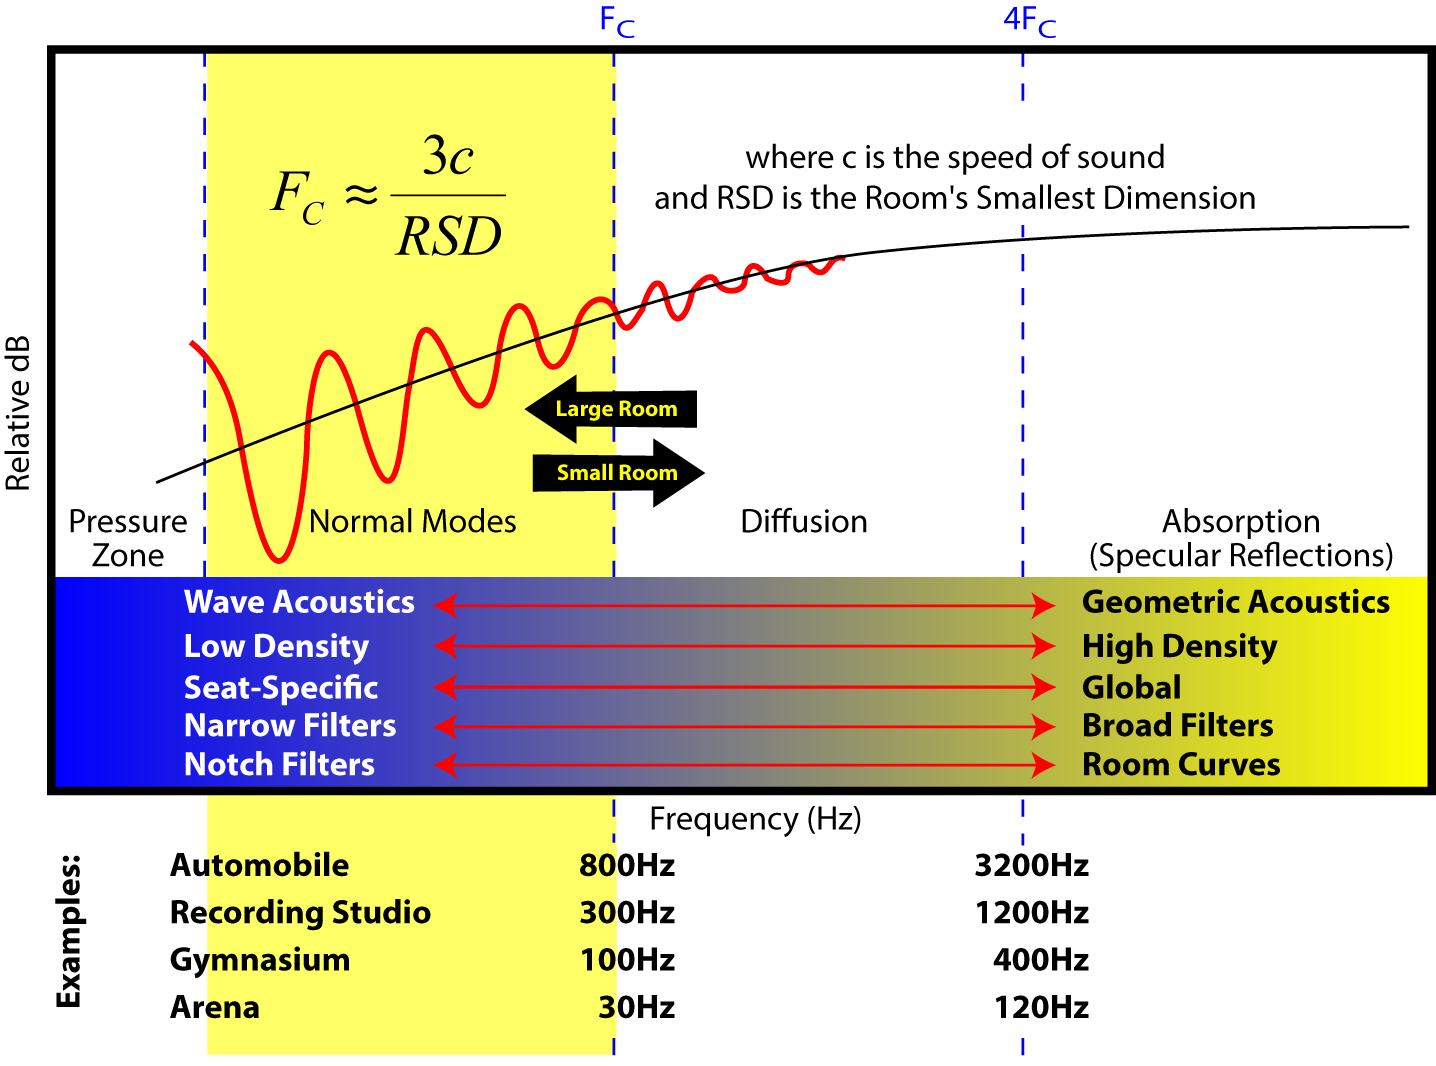
Figure 13 – The first step to addressing acoustics problems in any space is to determine FC. In small rooms the normal modes extend well up into the voice range. In large spaces they may only affect the subwoofer performance.
Conclusion
Solutions for poor room acoustics abound. We have an extensive pallet of tools for bad sounding rooms, including absorbers, reflectors, diffusors, bass traps, and more. Like the paint pallet used by an artist, the real issue is “what” to put “where.” The the thoughtful consideration of the RIR and FS helps ensure effective solutions for acoustic problems.
The consideration of FS allows room acoustics issues to be addressed more effectively. Just “throwing fuzz” at a room can have some unintended consequences and may aggravate the problem that you are trying to solve. All of the information needed to consider FS can be mined from the RIR, making its collection an important part of a room survey. pb
