Small Room Acoustics in the Zoom Era
by Pat Brown
Solving the acoustical problems of small spaces requires a different palette of tools than those used in large spaces.
Room resonances can extend well up into the speech range to complicate conferencing, recording, and online meetings creating some acoustic surprises.
Small room acoustics is getting a lot more attention than it used to. I wonder how many spare bedrooms around the world are now used for ZoomTM meetings, online training, and home offices? These small spaces can present some acoustic surprises. Here is a tale of one.
Working From Home
The project was to setup a computer workstation on one wall of a child’s bedroom to serve as a part-time “at home” production environment. The idea is to emulate the “at work” workstation – an identical recording setup in a well-controlled room of similar size. The edits and dubs made at home must blend seamlessly with the edits and dubs made at work. This gives the user the freedom to work at either location.
The room is small, measuring 12’ 4” x 10’ 7” x 8’ (3.76 m x 3.23 m x 2.44 m). A set of bunk beds occupy one of the long walls. A computer desk occupies the opposite wall. A large window covers much of one of the short walls and an entry door and bifold closet door the other. Two of the walls are drywall on studs and two of the walls are drywall on concrete block (1-inch furring strips).
The location of the computer workstation is not negotiable. It’s the only possible placement given the layout of the room (Figure 1). The recording mic is arm’s length from the 27-inch computer screen. The microphone is the Electro-Voice RE20TM. This is the same mic used at work. It was selected because the Variable-DTM design provides a cardioid pickup pattern without a proximity effect. The cardioid pattern is needed to mitigate the reflection from the computer screen.
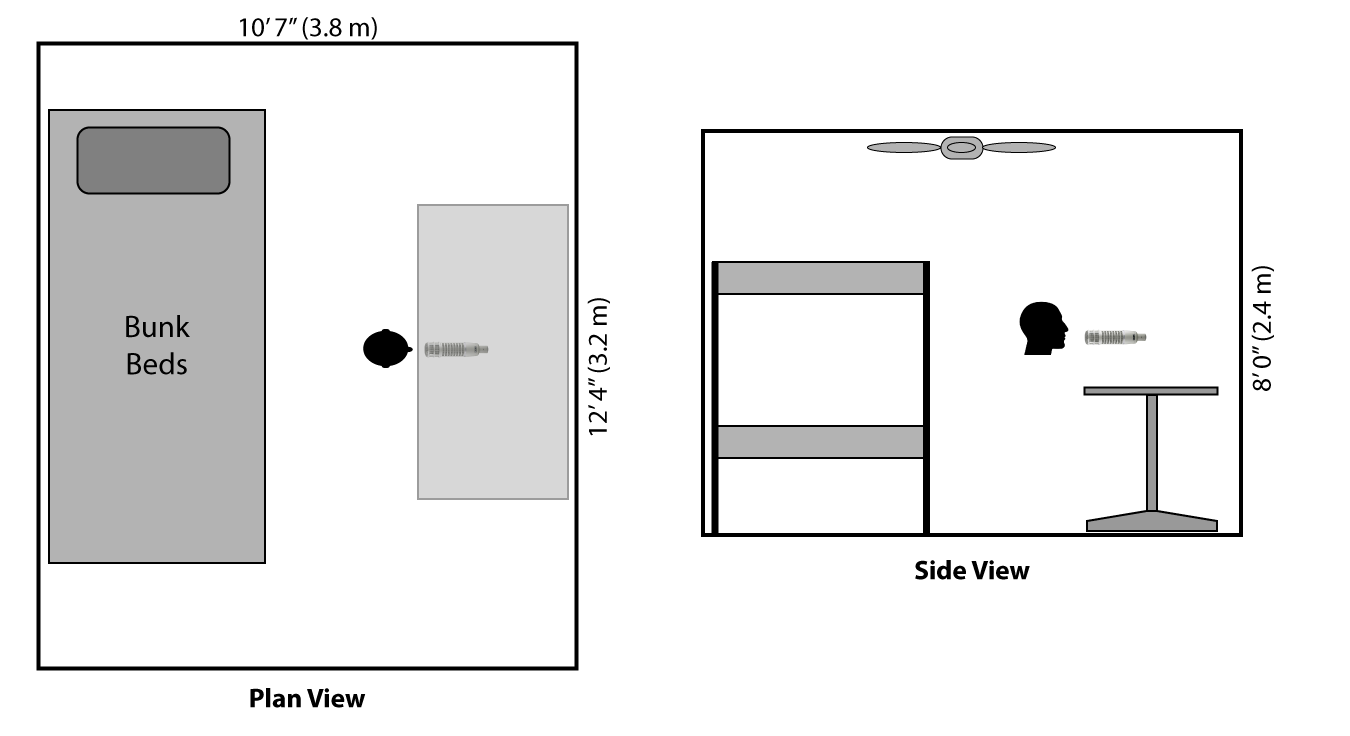
Figure 1 – The layout of the spare bedroom workspace.
The two bunk bed mattresses and carpeted floor provide sufficient absorption to hold the room’s decay time to about 300 ms. The “surprise” in this space is a series of LF resonances that rendered the room useless for voice-over recording at the workstation. The room effectively “rings like a bell” at 140 Hz. This became shockingly apparent upon the first attempt at recording at the workstation. It was laughably unusable. Equalization is an obvious first-try solution, but the required deep filter created a subjective impression of “something missing that should be there, and something there that shouldn’t be.” It just sounded bad. The only workable solution was a steep high pass filter at 250 Hz. While this would be okay for some applications, the thin sounding result would not work for the purpose of this workstation – to make corrections and dubs on recordings made at work. The two spaces need not be exact matches (nor could they be) but they had to be close enough for speech overdubs to be seamless.
Figure 2 shows a recording of a 14-sec log sweep made at the microphone position with the loudspeaker and recorder placed to emulate the recording setup. In a perfect (anechoic) world the sweep amplitude would not change over its duration. Something is obviously wrong in the LF decade. The modal region is marked, along with the critical frequency FC of 400 Hz. Above 400 Hz the room is transitioning to geometric sound behavior. Below 400 Hz it behaves more like a bowl of Jello. These resonances are the most significant acoustic issues in the space.
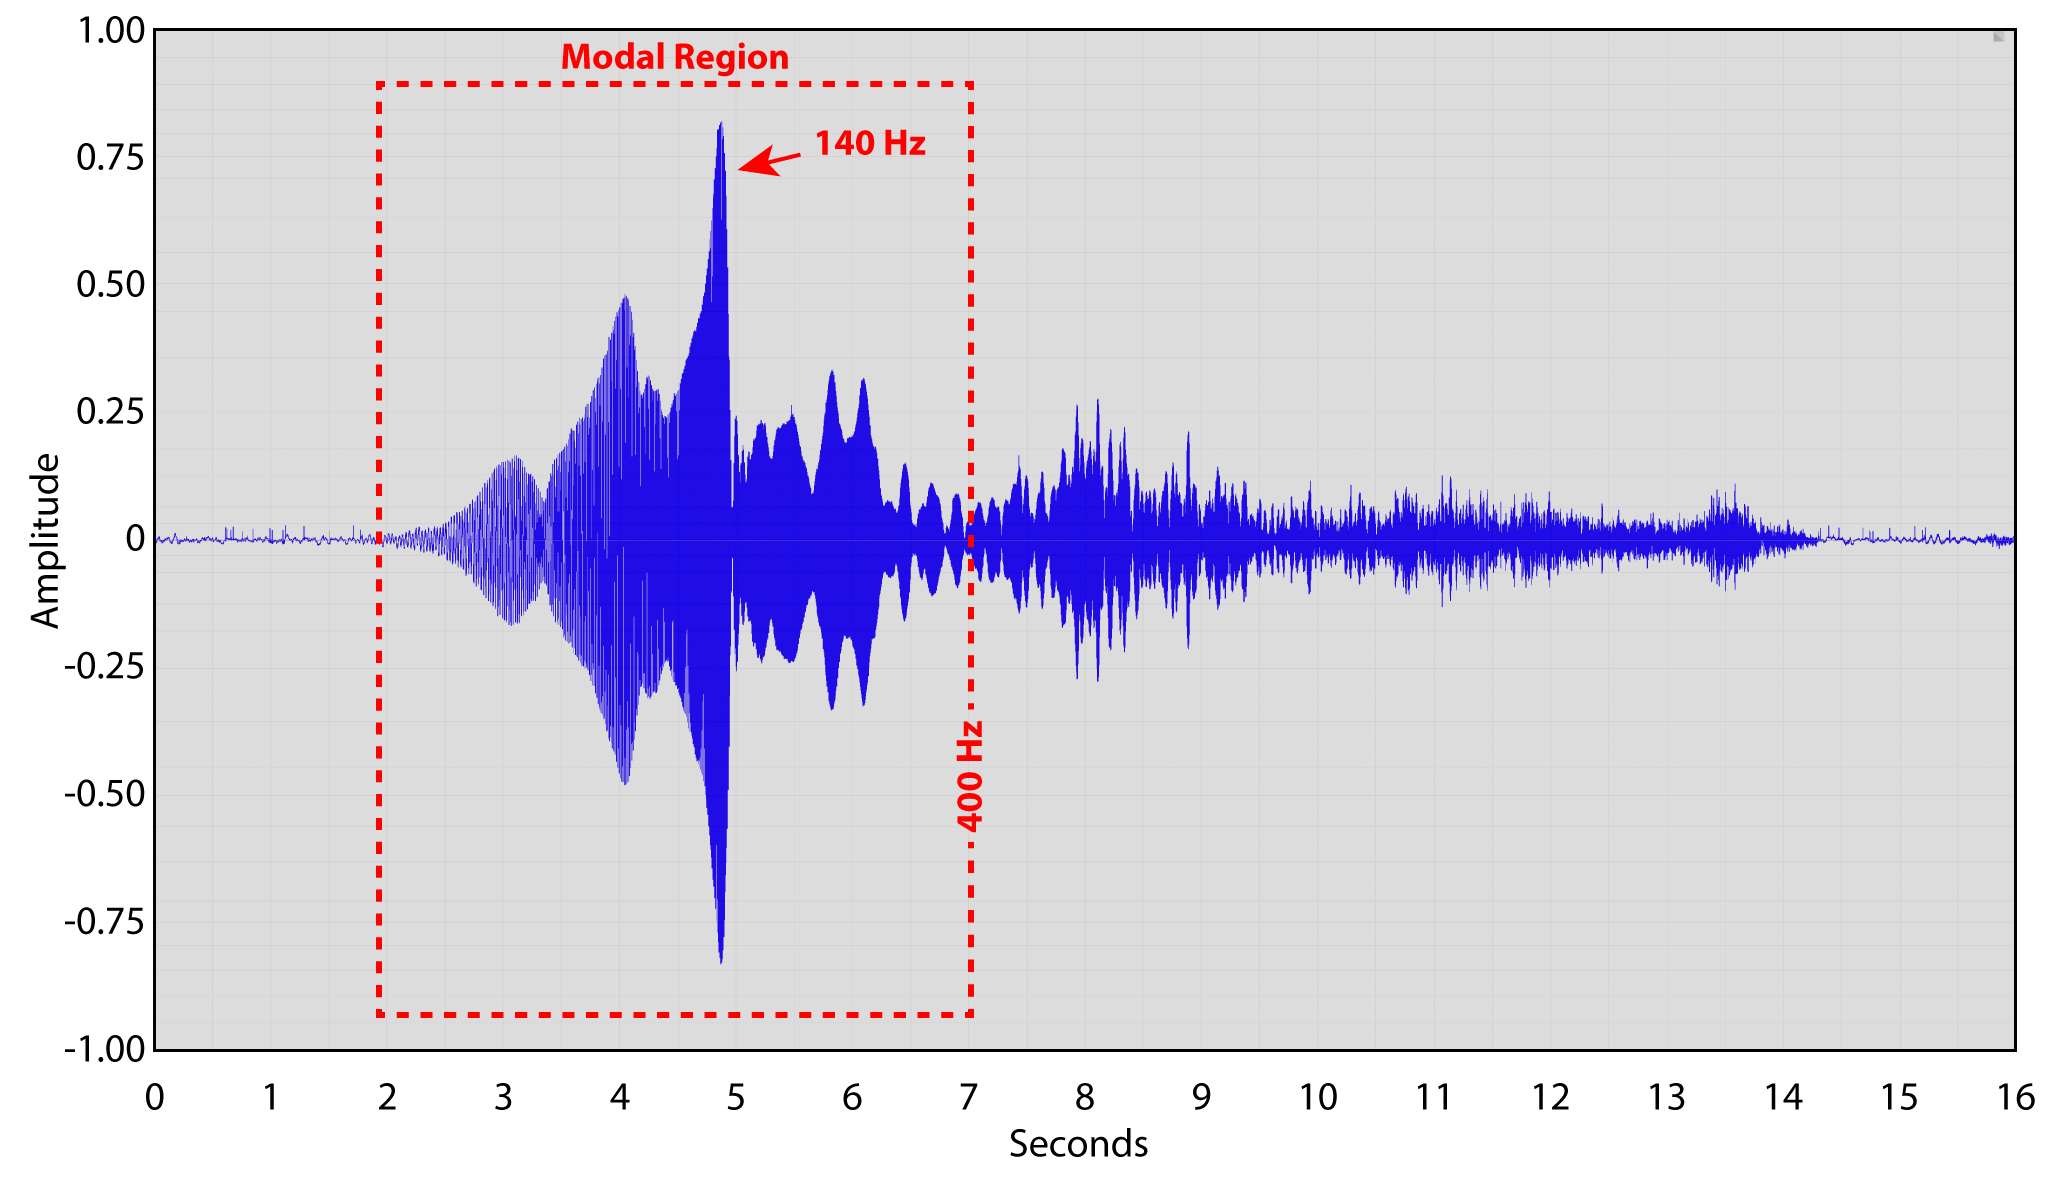
Figure 2 – A 14-sec log sweep recording at the microphone position. This was used to produce a room impulse response for further analysis.
As is often the case with small room modal issues one can simply pick a different talker/microphone position to mitigate (or at least change) the problem. Simply standing up made an audible change, but that is not a workable solution for this project.
The Perfect Storm
I immediately suspected a room geometry issue, but I did not expect “The perfect storm.” The dominant resonance by far is 140 Hz. That’s a wavelength of about 8 ft (2.44 m). That “agrees” with the floor-to-ceiling distance. It’s also in exact agreement with the round-trip distance from the mic-to-ceiling, mic-to-floor, and the mic-to-wall behind the computer. A frequency that is this dominant probably has more than one contributing factor, and there’s a “whole lotta 8 ft going on” in this room.
Modeling the Behavior
Since I suspected a modal contribution to the problem, I modeled the space in the Room Simulator of Room EQ WizardTM (REW). There are four anti-nodes present at this position (Figure 3). They are
- 3-0-0 Axial length (2 surfaces)
- 0-0-2 Axial height (2 surfaces)
- 2-2-0 Tangential length/width (4 surfaces)
- 1-2-1 Oblique (6 surfaces)
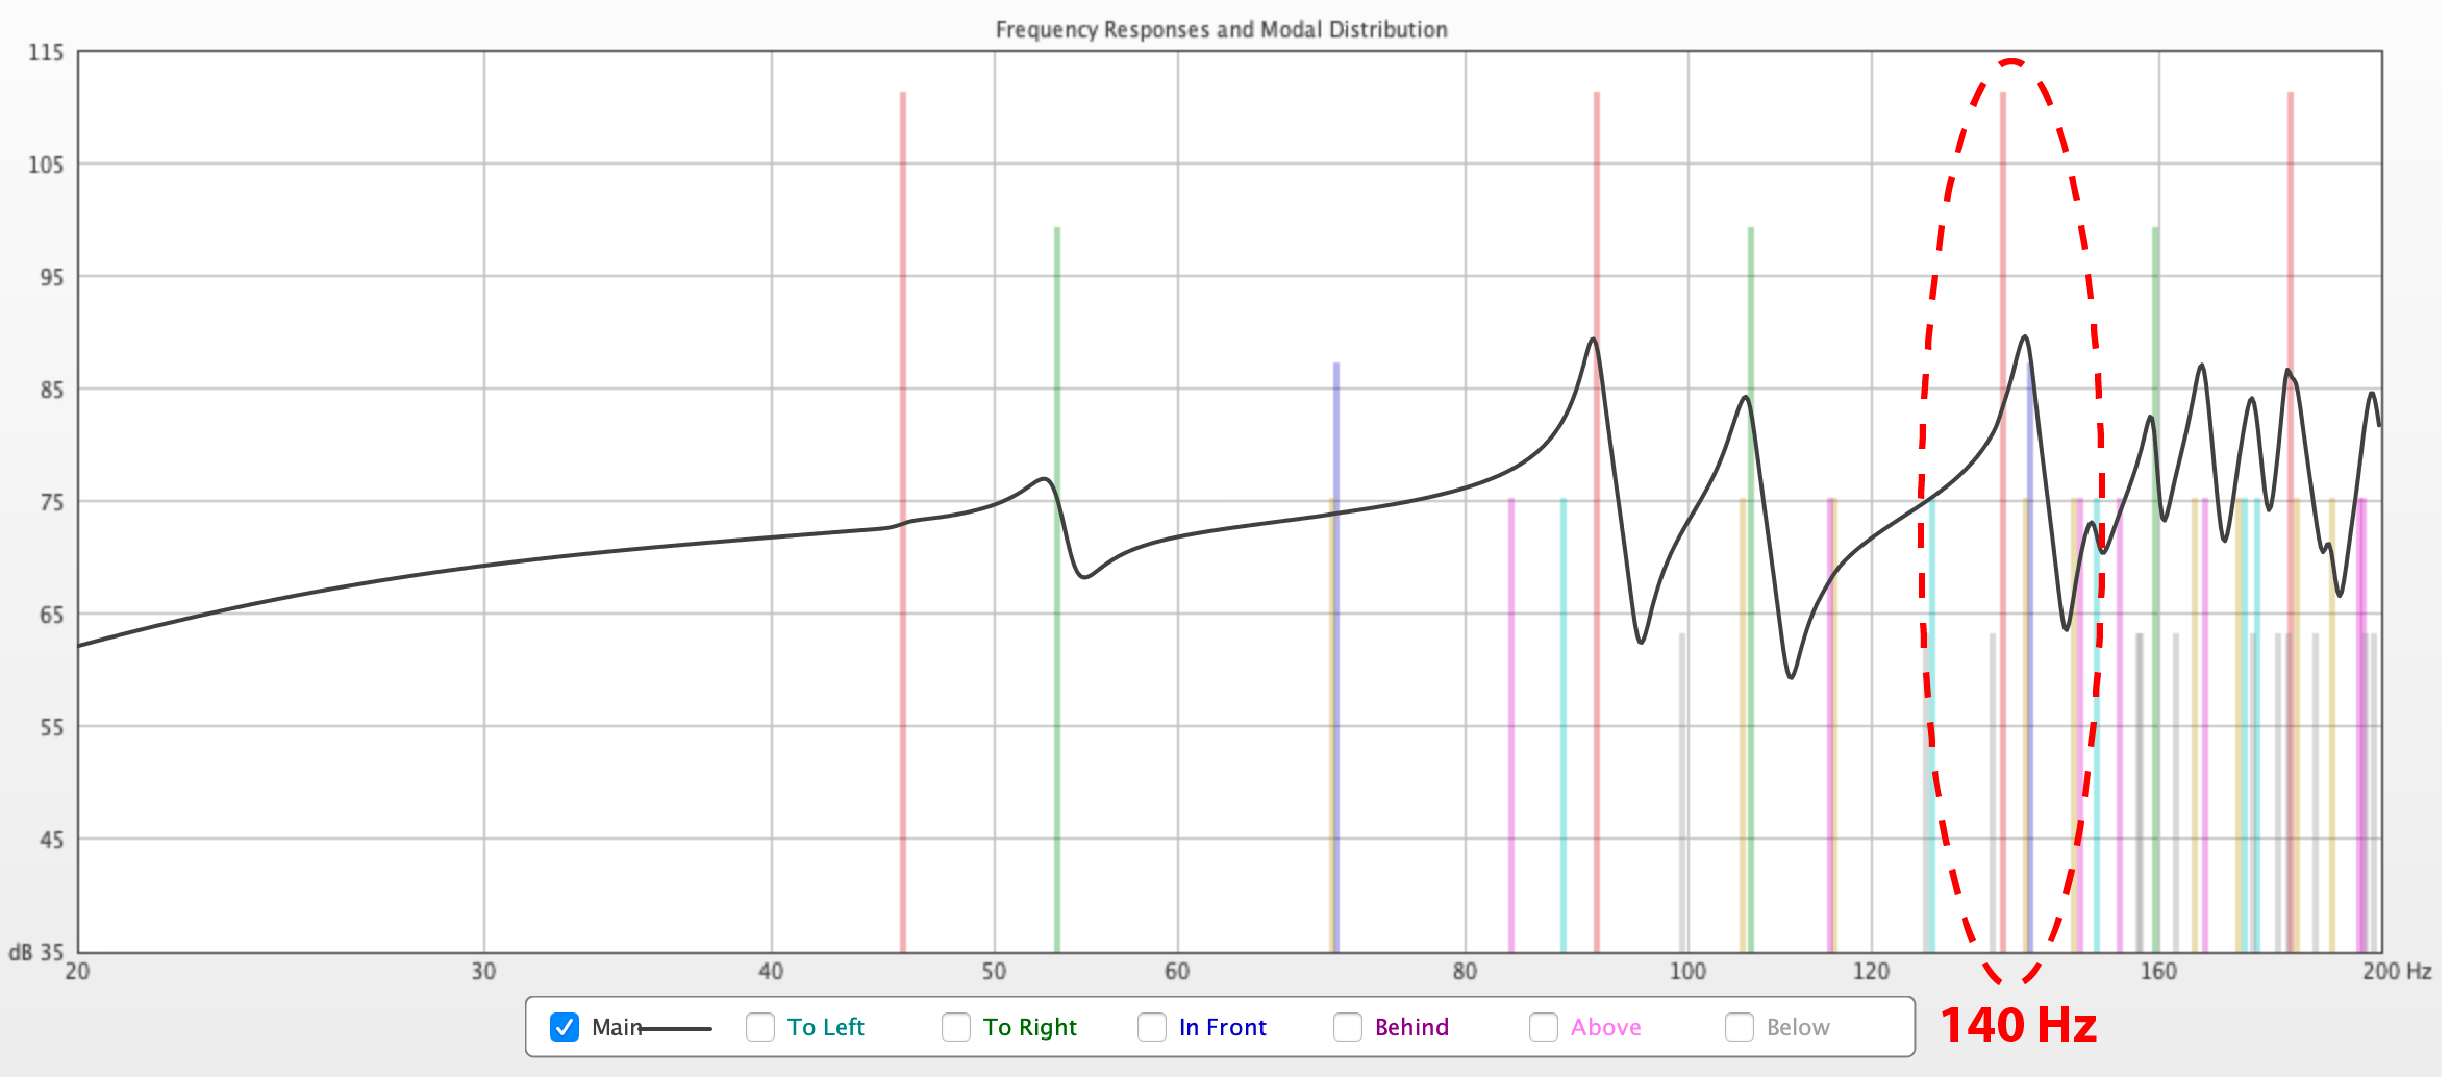
Figure 3 – Room Simulator module of Room EQ Wizard. The vertical lines are the calculated modes. The black trace is the predicted frequency response. Note the high modal density at 140 Hz.
While there are other significant modes in the spaces, the “pile up” at 140 Hz is unique.
In addition to the modal behavior, a first order reflection from the floor, wall, and ceiling produces an in-phase summation at the microphone position at 140 Hz since each surface is 1/2-wavelength from the talker/microphone. This space is a 140 Hz amplifier at the microphone position!
Visualizing the Problem
The log sweep recording was processed into the room impulse response (RIR) using GratisVolverTM. The RIR was imported into FIRCaptureTM for analysis. Modes are best viewed using a dual-domain plot of frequency on the Y-axis and time on the x-axis. This is the Cumulative Spectral Decay (CSD) plot. Figure 4 shows a 2D frequency/time plot (my preferred view) and Figure 5 shows a 3D waterfall.
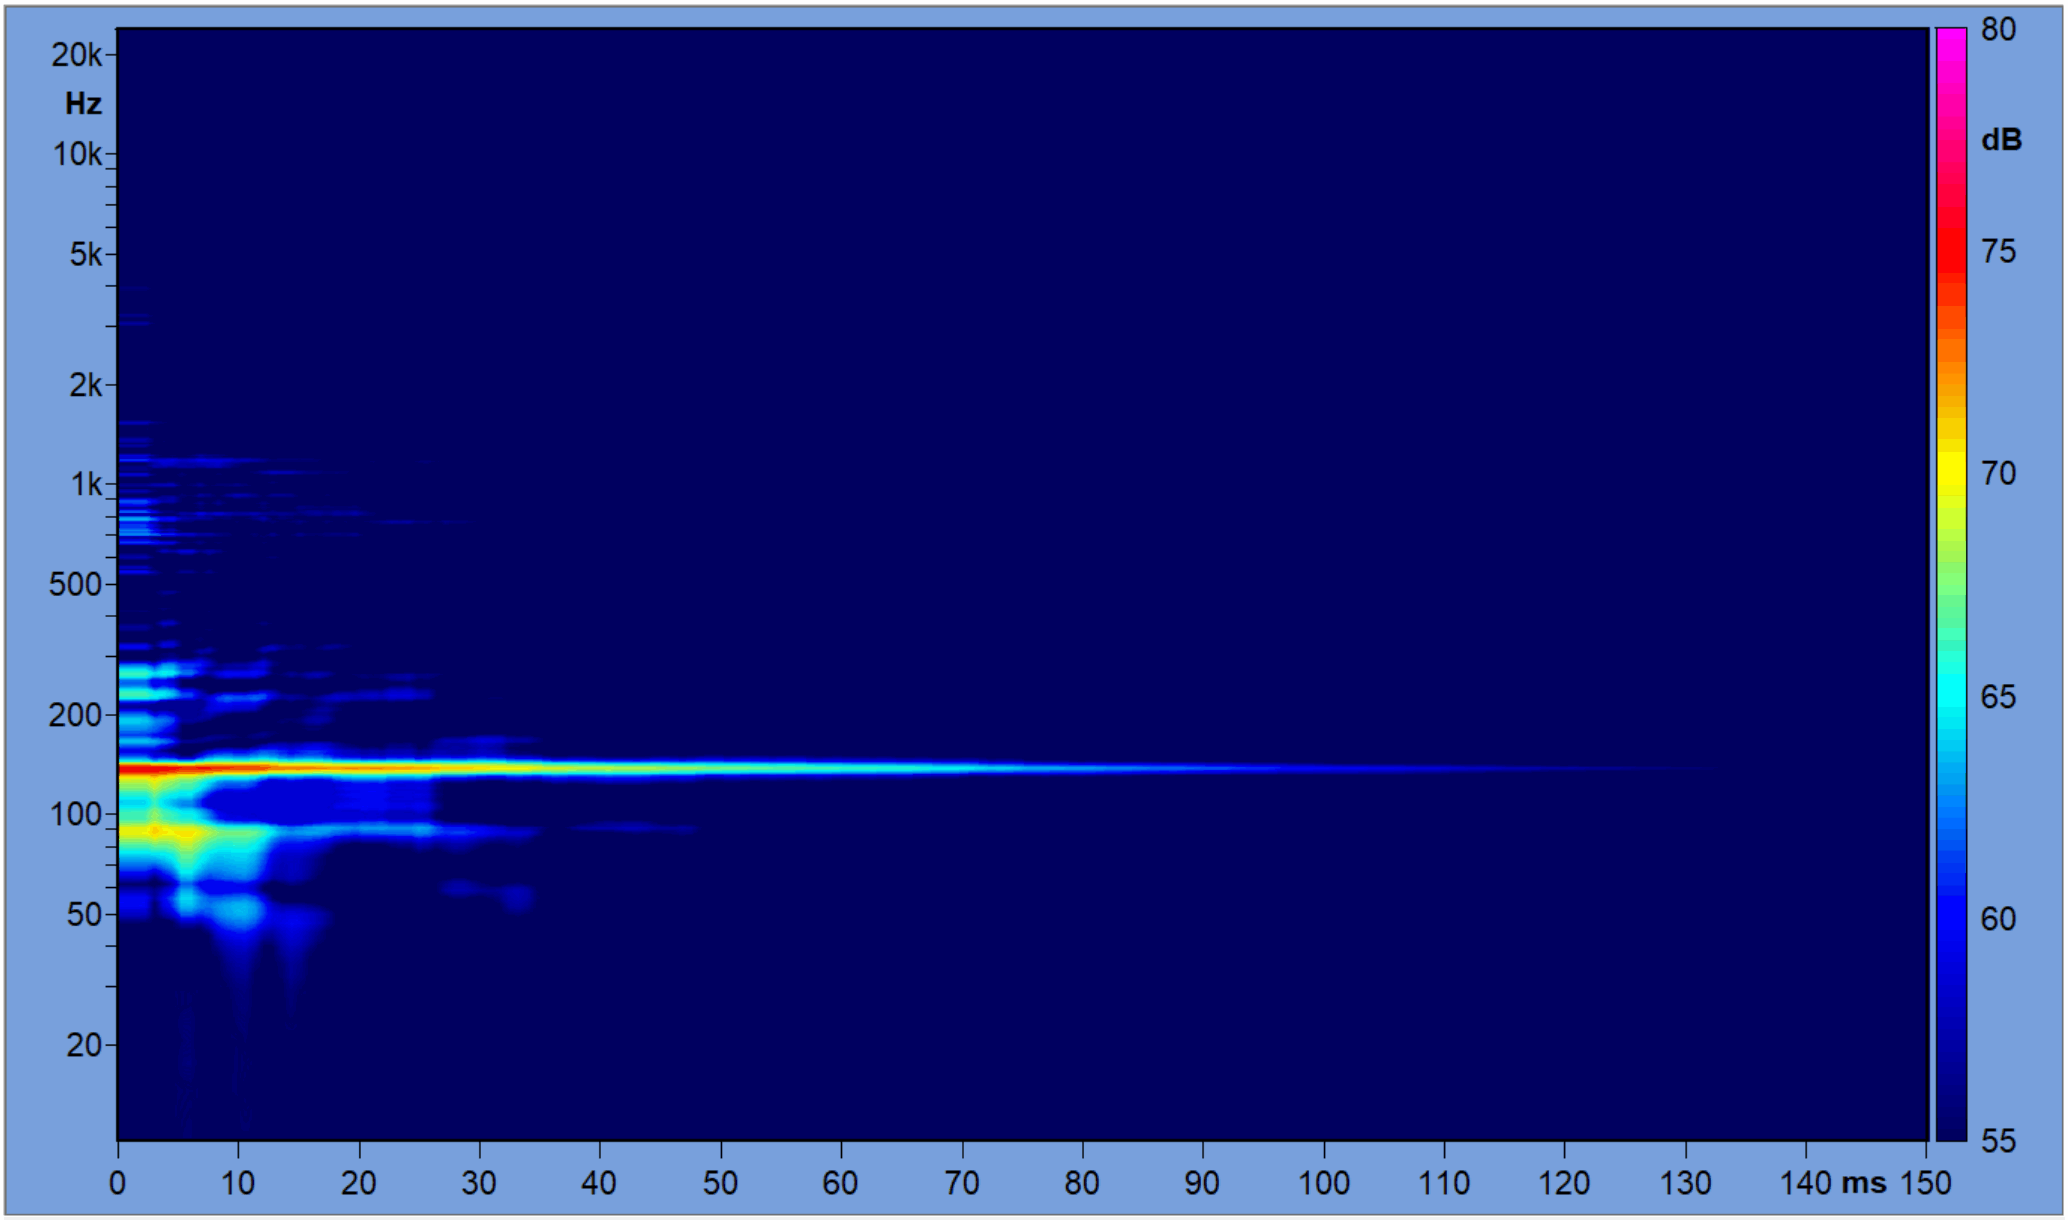
Figure 4 – Frequency/Time plot of the RIR.
The 140 Hz resonance is very high Q (narrow in frequency) and isolated. This makes it extremely audible and dominant at the microphone position, confirming what my ears had already told me.
Possible Treatment Locations
An old trick for determining possible placements for treatment is to place a loudspeaker at the talker/microphone position and emit the offending frequency. One can then wander around the space and find the “hot spots” by listening or with a sound level meter. These pressure maxima are the most effective locations for treatment. This exercise revealed the mid-point of wall behind the computer, the ceiling above the mic, and the floor below the mic as the most promising candidates for treatment placement. The corners to the left and right of the workstation also lit up, but over a fairly small region. I couldn’t treat them all, so I decided to treat the wall behind the PC. If this proved inadequate, I’d also place treatment on the ceiling above the workstation.
Treatment Type
The acoustic wavelength of 140 Hz is 8 ft (2.44 m). A general guideline is that for a porous absorber to be effective, it should be at least ¼ wavelength at the frequency of interest. That comes out to 2 ft, which is a very thick absorber. I would get a lot more action from a resonant panel. After reviewing the published specifications of lots of LF treatment products I decided on the Modex PlateTM from RPG Acoustical Systems. The form factor would work, the specs looked believable, and RPG and SynAudCon go back a long way. For what it’s worth, many of the LF treatment products that I researched looked too good to be true. How can a 2-inch mineral wool panel exhibit nearly complete LF absorption? Of course it can’t. RPG has a science/engineering pedigree and I knew that the specs could be trusted. These are sold in sets of four, and while I could use four panels the cost was prohibitive for this project. They agreed to sell me two, which I hoped would do the job. Figure 6 shows the absorption data for a Modex Plate.
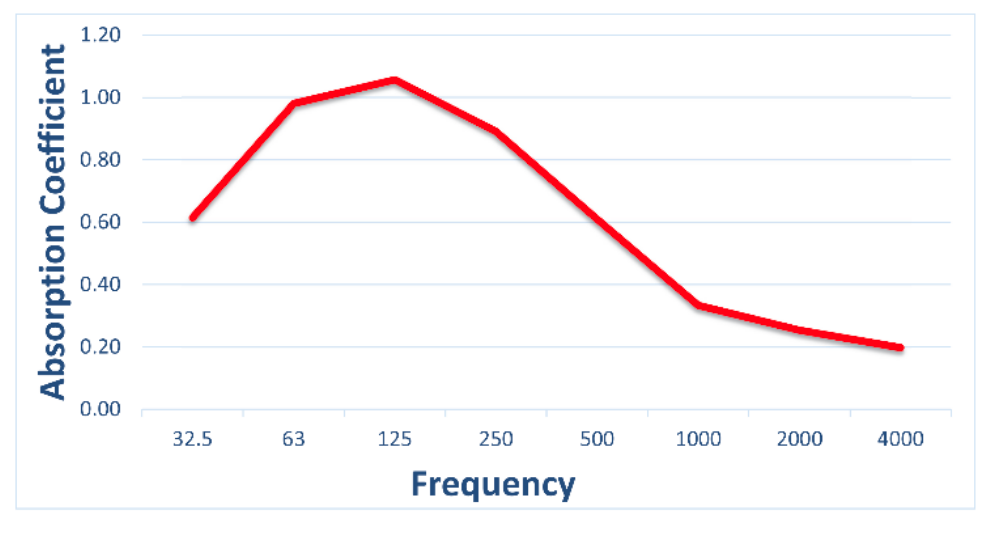
Figure 6 – The sound absorption chart above represents the octave band performance of the Modex™ LF in a reverberation chamber per ISO 354.
Treatment Location
Since the resonance has multiple causes, I knew that two panels would not completely eradicate the problem. The objective was to reduce it to an acceptable level.
My original intent was to place one panel behind the PC, and one on the ceiling above the PC. Both of these locations had a very high sound level during the listening test. Since the ceiling placement was more of a challenge (ceiling fan, mounting) I initially just stacked the panels behind the PC. The benefit was immediately audible, and I breathed a sigh of relief. It is gratifying when the theory works. Shoe-box rooms are fairly predictable in the modal range and the math turned out to be right. Due to the simplicity and effectiveness of this placement I decided to just stick with it. Ideally I would also like one on the ceiling above the workstation – maybe in the future.
The Results
Figure 7 shows the 2D CSD with the panels in place. Figure 8 shows the 3D waterfall. Compare these to Figures 4 and 5. Not only did the panels dampen the resonance, the Q is reduced. Both serve to reduce its audibility and dominance on the recordings. I still applied a 1/1-oct dip filter (-4 dB) at 125 Hz to subjectively match the speech dubs to those made in the “at work” space. This broad filter helped compensate (not correct) for the remaining modal behavior.
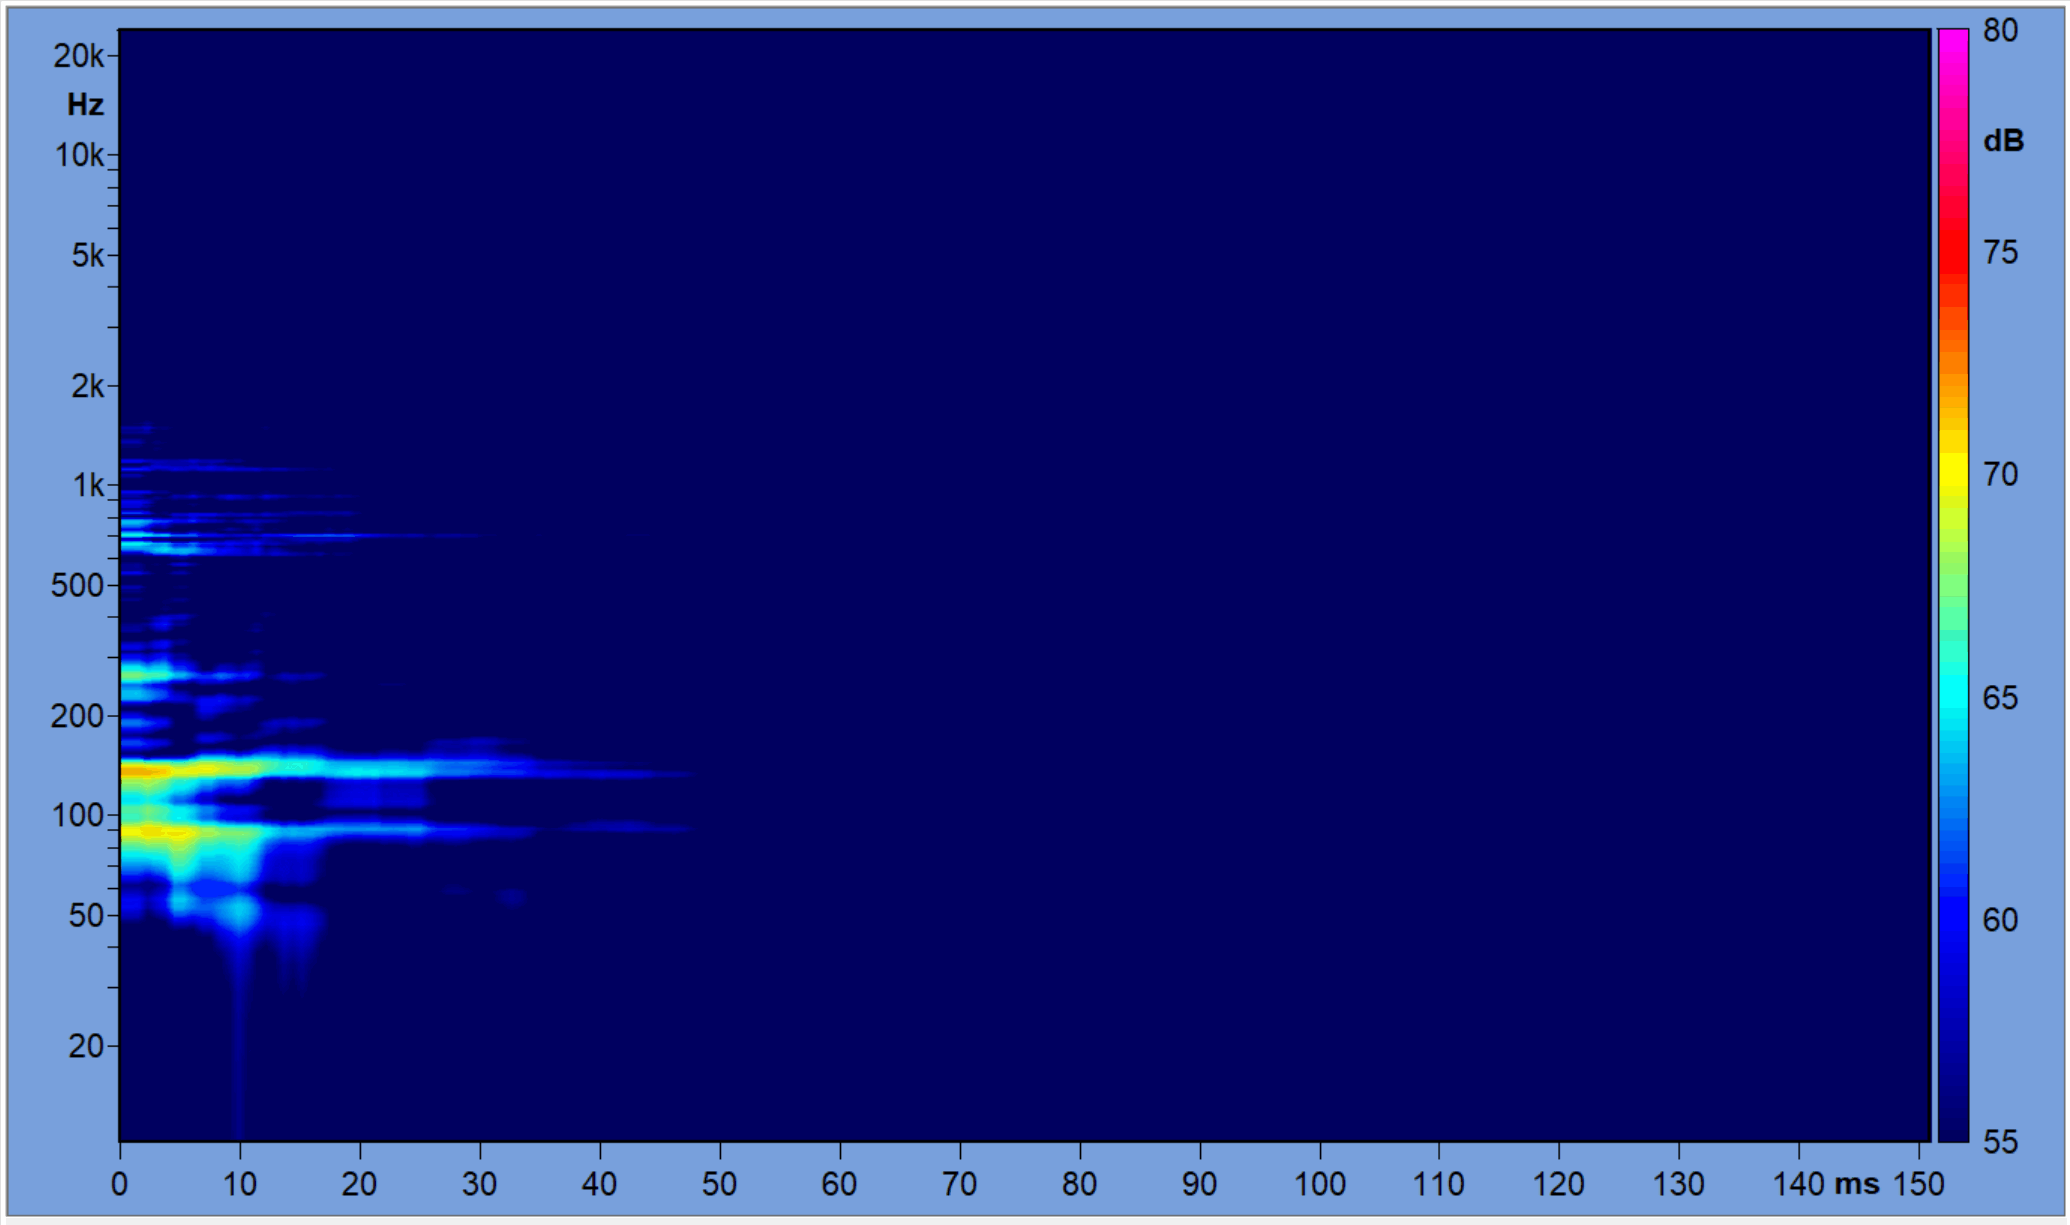
Figure 7 – Frequency/Time plot of the RIR after placement of the panels.
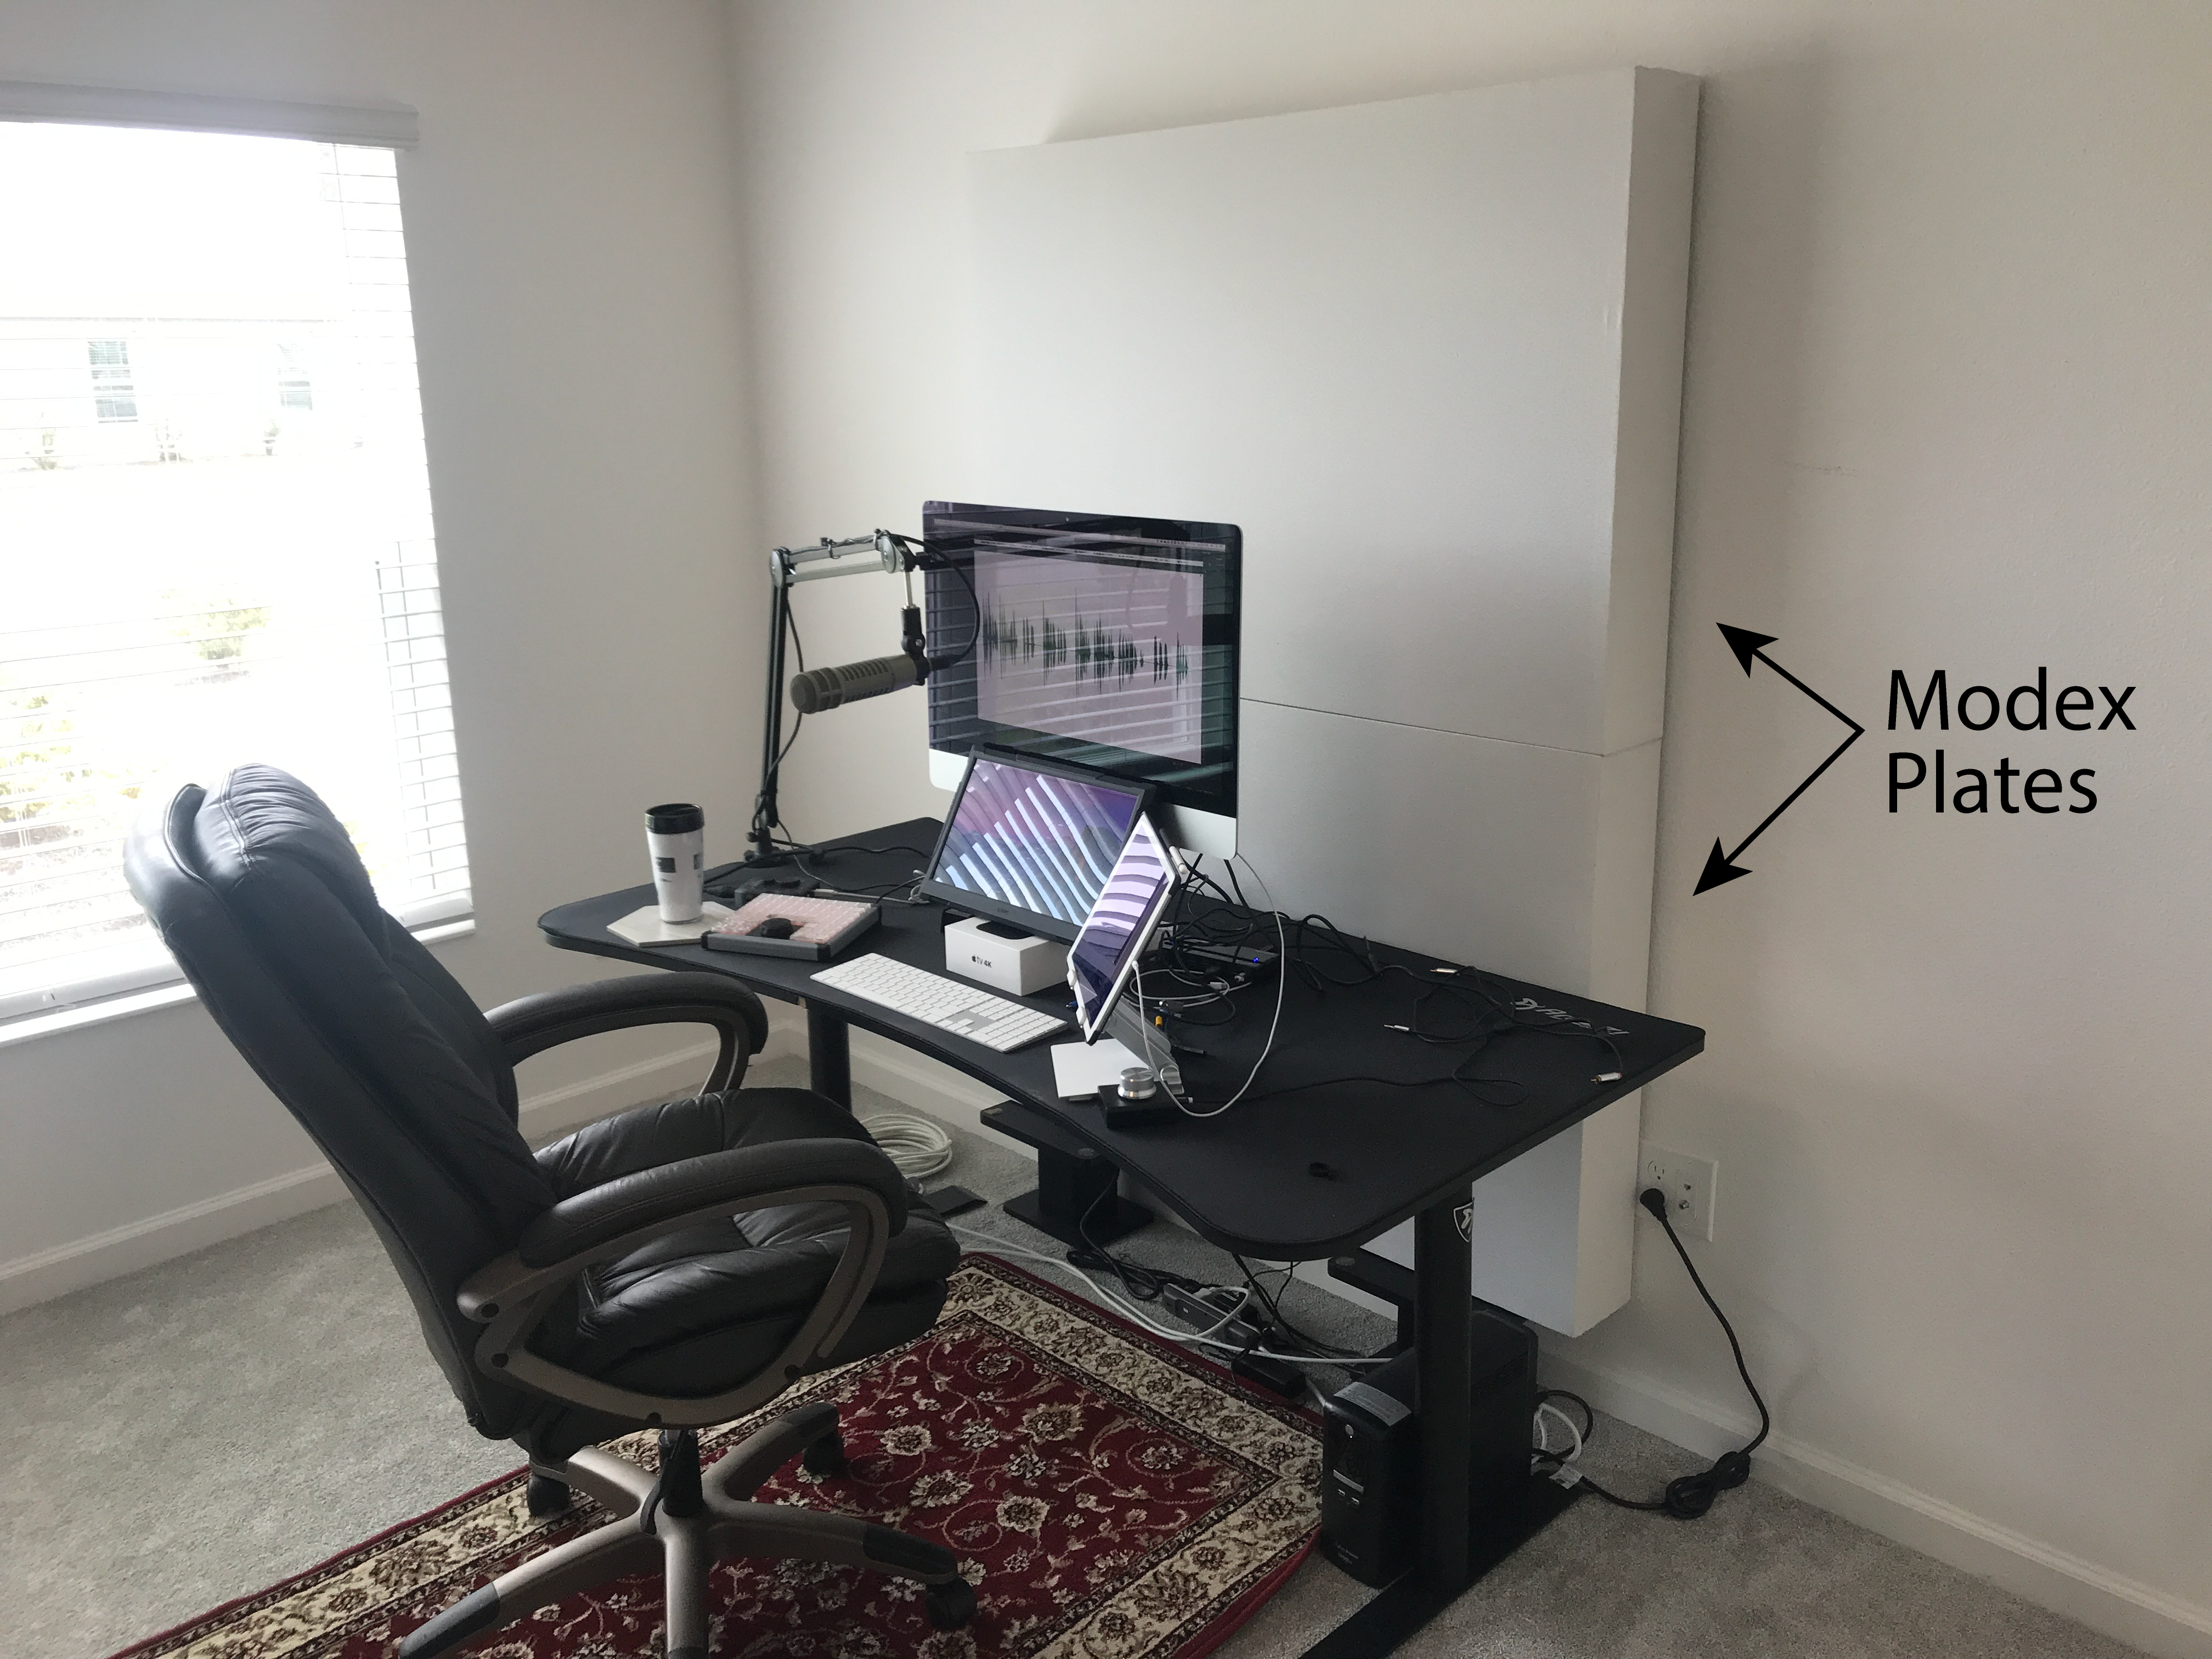
Figure 9 – The Modex plates in place.
Conclusion
Most of us have spent our audio careers in large spaces. We are well-acquainted with large room problems such as reverberation, signal-to-noise ratio, and speech intelligibility. Moving forward we must shift that expertise to small rooms that are dominated by room modes, noise issues, and microphone selection and placement. It’s important to match the theory to the space by recognizing the significance of critical frequency and resultant acoustical zones. Small rooms are not typically reverberant. This “perfect storm” modal issue cannot be analyzed using reverberation equations.
Room mode measurement, identification, and treatment is now in the forefront for many audio professionals. We already have the tools. Everything needed is in the RIR. The future belongs to those who can collect it and interpret it. pb
