Capturing the Room Impulse Response with an Ambisonic Mic
This article will present comparative result between omni mic vs A-format mic for capturing the room impulse response.
Ambisonic has gained a lot of attention in the recording world due to the rise of virtual reality. This technological advancement has already explored in acoustics world however the implementation was not found widely yet. This article is inspired by a measurement technique shown by Mr. Pat Brown in one of his SynAudCon seminars in 2013. The technical detail of each measurement is not presented. However, this article will present comparative result between omni mic vs A-format mic for capturing the room impulse response.
The software and hardware used in this article are as follows:
- Omni mic: Earthworks M30BX
- Portable ambisonic recorder: Zoom H3-VR
- Software: AFMGtm EASERAtm, AFMG Systunetm, CATT ReflPhindertm
- Binaural head: Binaural Enthusiast dummy head
- Various loudspeakers
Frequency Response and Impulse Response
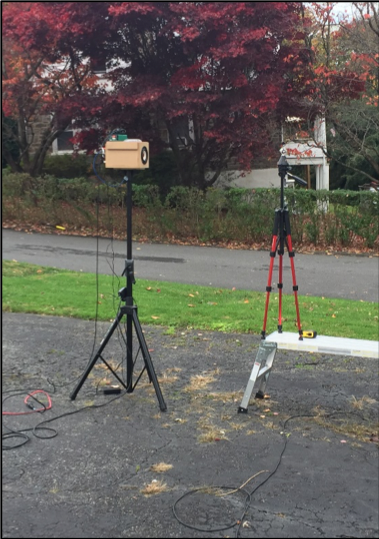
When using an ambisonic recorder/microphone, one will notice the multi-capsule microphone in the A-format arrangement. The first thing that we are going to compare is the calculated omni signal from an ambisonic recorder vs a real omni mic. Please see figure 1 below showing a simple outdoor measurement of a small 4in one-way loudspeaker with the H3-VR and M30BX omni mic.
Due to the multi-capsule arrangement, we will expect a high frequency limitation. This can be simply predicted with a simple formula, however let’s dive in straight to the measurement to see the result more vividly. The loudspeaker and the microphone are approx. 1.5m above the ground and the distance between mic and loudspeaker is approx. 1m.H3-VR is set to record B-format wave files and we’re going to compare the W (omni) wave file of the H3-VR to the pure omni mic measurement.
The loudspeaker’s frequency response is approx. flat down to 180Hz. Since the data taken with the Zoom H3-VR is only a single measurement (no averaging), the red curve is not accurate below 200Hz due to the outdoor noise.Reader can notice a dip in frequency response around 6.5kHz. It can be concluded that the calculated omni from H3-VR and the omni mic measurements are similar up to 5kHz. Side note: this is a direct sound measurement that includes one ground floor reflection. The frequency response results may be closer when the measurement includes more room reflections.Let’s observe the time domain graphs.
Figure 4 shows the zoomed in impulse response. As one may expect, the omni microphone shows a cleaner result.
Figure 5 shows the ETC up to 30ms after the direct sound arrival. Reader can notice the ETC similarities between H3-VR and M30BX. This is a good sign that the H3-VR can be used for acoustics work.Figure 5 also shows a floor reflection that arrives approx. 7.5ms after the direct sound arrival. Using an omni mic, this reflection can’t be analyzed further, however using H3-VR ambisonic data, we can further use software such as ReflPhinder to analyze where the reflection comes from.
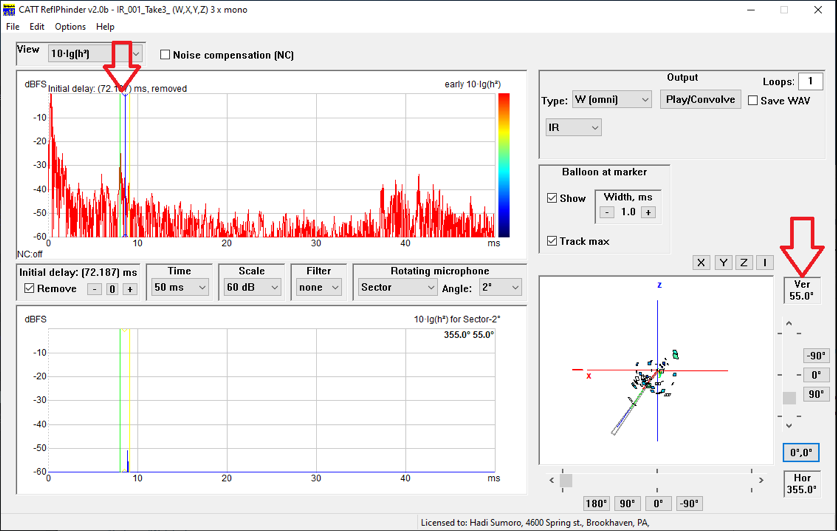
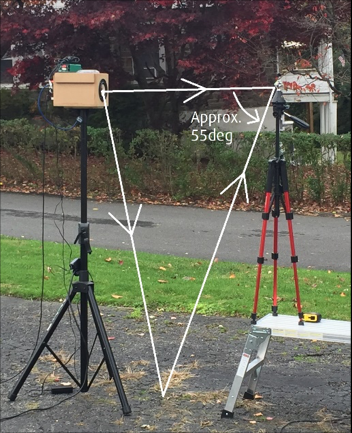
Figure 6 shows an analysis of the first reflection (7.5ms after the direct sound), showing that it comes approx. 55deg down from the front on-axis of the H3-VR as setup in figure 1. Figure 7 explains figure 6 in a more illustrative way.
Acoustic Parameters
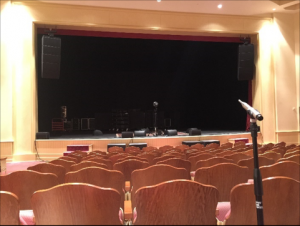
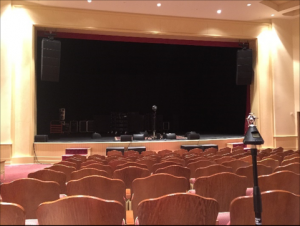
To further observe the usability of the ambisonic mic for acoustical analysis, another experiment was done in a medium performance hall. Figure 8 shows a snip of the room impulse response measurement using Zoom H3-VR and M30BX. A small dodecahedron loudspeaker is used for the evaluation.
Figure 8 – Room Impulse Response Measurement Using M30BX and H3-VR at a Same Location
Let’s compare the C50, C80, T20 and T30 from two different measurement locations. The reader can compare the blue curve against the brown curve and the green curve against the red curve.

Figure 9 – Location 1: Blue is M30BX T20, Green is M30BX T30, Brown is H3-VR Omni T20, and Red is H3-VR Omni T30

Figure 10 – Location 2: Blue is M30BX T20, Green is M30BX T30, Brown is H3-VR Omni T20, and Red is H3-VR Omni T30

Figure 11 – Location 1: Blue is M30BX C50, Green is M30BX C80, Brown is H3-VR Omni C50, and Red is H3-VR Omni C80

Figure 12 – Location 2: Blue is M30BX C50, Green is M30BX C80, Brown is H3-VR Omni C50, and Red is H3-VR Omni C80
Figure 9 – 12 show very similar C50, C80, T20 and T30 measured with the M30BX omni mic and Zoom H3-VR recorder. The use of ambisonic mic/recorder seems very promising for acoustical work especially its ability to store the directional information.
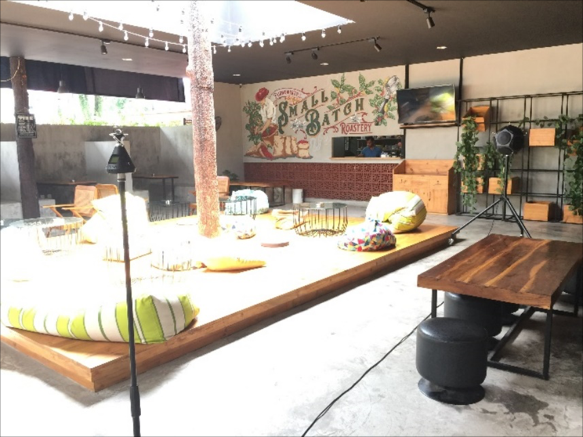
On another occasion, we also experimented the Zoom H3-VR vs Binaural Enthusiast dummy head. The measurements were done in a small coffee shop (figure 13) which is semi-outdoor. The measurement accuracy is only at >300Hz due to the road noise.
We measured a binaural stereo file from the H3-VR and compared it with the direct binaural measurement from a dummy head. The A-format to binaural stereo file conversion in the H3-VR is done internally. Using EASERA, we compared IACC result in figure 14 below.

Figure 14 – IACC, Red is Binaural stereo file from H3-VR, Green is Binaural IR measurement from a dummy head
We expected slight difference due to the different HRTF filters used in H3-VR recorder and the HRTF from the real dummy head. However, the results we found so far have good correlation. The Ambisonic mic/recorder does show promising use for acoustic work. We would like to thank Mr. Handy Widjaya of Excellent Sound Art, Jakarta, Indonesia for the use of the dodec and dummy head, Society Coffee House, Purwokerto, Indonesia and Baby Grand Opera House, Delaware, USA for the venue data acquisitions. We also appreciate and thank Mr. Pat Brown of Synergetic Audio Concepts for sharing the useful measurement technique and his insight on the article.
Hadi Sumoro HX Audio Lab

