Why Do We Equalize In 1/3-Octave Bands?
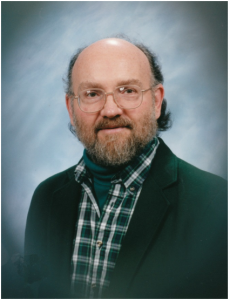
by Richard Honeycutt
Richard Honeycutt explains why most equalize in 1/3 Octave Bands. He has included 30 sound clips so readers can evaluate the perceptibility of frequency-response deviations.
A recent forum thread has discussed the question of why we EQ in 1/3-octave bands. Let’s discuss this, as well as the related question of why we use 1/3-octave smoothing on most mic and speaker frequency response graphs.
In 1933, Harvey Fletcher of Bell Labs proposed the designation of critical bands as a way to help understand human sensitivity to pitch, and the relationship of masking to the frequency of the masked sound and that of the masking sound[i]. We now know that pitch determination is made as a result of the frequency sensitivity of the position along the cochlea activated by a certain pitch.
(See Figure 1.)

Figure 1: Frequency Map of Human Cochlea (https://community.plm.automation.siemens.com/t5/Testing-Knowledge-Base/Critical-Bands-in-Human-Hearing/ta-p/416798)
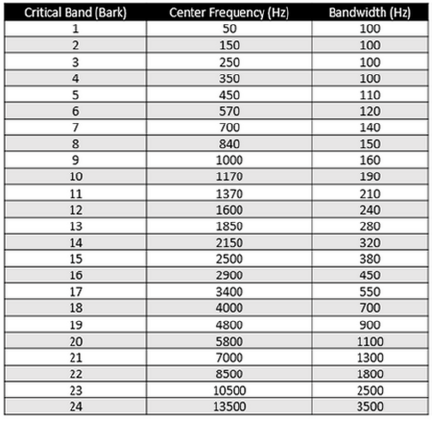
If two tones are heard simultaneously, and are in the same critical band, they will be perceived as a single tone with a “beat frequency” modulating the loudness of the tone. The beat frequency is the difference in Hz between the two tones’ frequencies. If the tones are in different critical bands, they will be perceived as two distinct tones. The 24 critical bands are defined in Table A:

Table A: Frequencies of the Critical Bands (https://community.plm.automation.siemens.com/t5/Testing-Knowledge-Base/Critical-Bands-in-Human-Hearing/ta-p/416798)
Notice that the critical bandwidth increases with frequencies. If we look at the 1/3-octave bands whose center frequencies cover the 50-Hz to 12,500 Hz (13.5 kHz, the center of critical band 24, is not a 1/3-octave-band center frequency) we find that there are 24 1/3-octave bands also. The bandwidths of the critical frequencies range from 100 Hz at low frequencies to 3500 Hz at high frequencies. The bandwidths of the 25 1/3-octave bands range from 11.5 Hz for the 50- Hz band to 2900 Hz for the 12.5-kHz band.
Figure 2 shows the relationship of critical bandwidth to 1-3-octave bandwidth.

Figure 2: Relationship of Bandwidths to Critical- and Octave-Band Center Frequency
The use of 1/3-octave bands is more convenient mathematically than the use of critical bands, so for analysis and equalization, 1/3-octave bands have become the de facto standard.
Does the information presented in this blog justify us in using 1/3-octave resolution for EQ, and 1/3-octave smoothing for frequency response graphs? Being a perfectionist by nature, I was initially uncomfortable with these practices. Then for a couple of decades, I designed speaker systems for live sound, so I did some experimenting and found that indeed high-Q spikes and dips in frequency response are much less audible than those whose Q is 1/3 octave or more. I also found that even a 1/3-octave-wide dip is not very perceptible. Peaks affect the sound more than dips do.
I have created 30 sound clips so that readers can evaluate the perceptibility of frequency-response deviations for themselves. You can play them in your browser at the end of this article.
Each clip is 30 seconds long; the first 15 seconds are not filtered, and the remaining 15 seconds are filtered according to the list above. Listen to these clips on an excellent pair of headphones. Computer speakers are typically not accurate enough for you to make a meaningful evaluation, even if the room acoustics of your environment did not affect the results, which they will. Run-of-the-mill headphones having random mid-bass boost will also skew your results.
Probably you will hear some of the filter effects and not others. Those of us who think we truly have golden ears may be humbled by how much filtering has to be applied before we can hear it! (But if you can’t hear at least the 12-dB peaks, you may be a candidate for Dave Moulton’s Golden Ears course.)
The frequencies chosen are the ones at which I have found critical listeners will most readily perceive frequency-response irregularities. If both you, dear reader, and I had unlimited time, we could investigate many more frequencies and amplitudes of response irregularities, but alas, ′tis not so! rh
[i] Fletcher, Harvey: “Auditory Patterns”, Rev. of Modern Physics”, 12, 47-65 (1940).
1. Pink noise—1 dB dip 1/3 octave wide, at 250 Hz.
2. Pink noise—3 dB dip 1/3 octave wide, at 250 Hz.
3. Pink noise—1 dB peak 1/3 octave wide, at 250 Hz.
4. Pink noise—3 dB peak 1/3 octave wide, at 250 Hz.
5. Pink noise—1 dB dip 1/3 octave wide, at 2500 Hz.
6. Pink noise—3 dB dip 1/3 octave wide, at 2500 Hz.
7. Pink noise—1 dB peak 1/3 octave wide, at 2500 Hz.
8. Pink noise—3 dB peak 1/3 octave wide, at 2500 Hz.
9. Male speech—1 dB dip 1/3 octave wide, at 250 Hz.
10. Male speech —3 dB dip 1/3 octave wide, at 250 Hz.
11. Male speech —1 dB peak 1/3 octave wide, at 250 Hz.
12. Male speech —3 dB peak 1/3 octave wide, at 250 Hz.
13. Male speech —1 dB dip 1/3 octave wide, at 2500 Hz.
14. Male speech —3 dB dip 1/3 octave wide, at 2500 Hz
15. Male speech —1 dB peak 1/3 octave wide, at 2500 Hz
16. Male speech —3 dB peak 1/3 octave wide, at 2500 Hz
17. Music—1 dB dip 1/3 octave wide, at 250 Hz.
18. Music—3 dB dip 1/3 octave wide, at 250 Hz
19. Music—1 dB peak 1/3 octave wide, at 250 Hz.
20. Music—3 dB peak 1/3 octave wide, at 250 Hz.
21. Music—1 dB dip 1/3 octave wide, at 2500 Hz.
22.Music—3 dB dip 1/3 octave wide, at 2500 Hz.
23. Music—1 dB peak 1/3 octave wide, at 2500 Hz.
24. Music—3 dB peak 1/3 octave wide, at 2500 Hz
25. Music—6 dB dip 1/3 octave wide, at 2500 Hz
26. Music—6 dB peak 1/3 octave wide, at 2500 Hz
27. Music—12 dB dip 1/3 octave wide, at 2500 Hz
28. Music—12 dB peak 1/3 octave wide, at 2500 Hz
29. Music—12 dB dip 1/3 octave wide, at 250 Hz
30. Music—12 dB peak 1/3 octave wide, at 250 Hz
 Richard A. Honeycutt developed an interest in acoustics and electronics while in elementary school. He assisted with film projection, PA system operation, and audio recording throughout middle and high school. He has been an active holder of the First Class Commercial FCC Radiotelephone license since 1969, and graduated with a BS in Physics from Wake Forest University in 1970, after serving as Student Engineer and Student Station Manager at 50-kW WFDD-FM. His career includes writing engineering and maintenance documents for the Bell Telephone System, operating a loudspeaker manufacture company, teaching Electronics Engineering Technology at the college level, designing and installing audio and video systems, and consulting in acoustics and audio/video design. He earned his Ph.D. in Electroacoustics from the Union Institute in 2004. He is known worldwide as a writer on electronics, acoustics, and philosophy. His two most recent books are Acoustics in Performance and The State of Hollow-State Audio, both published by Elektor.
