Line Array Intelligibility Study
by Pat Brown
A demonstration and investigation of seven active beam-steered arrays and a passive array Intelligibility study in a reverberant space.
Active beam-steered line arrays have become popular for use in large, reverberant spaces. They can produce a strong direct sound field at listeners with minimal room excitation, resulting in dramatically higher speech intelligibility than can be realized with conventional point source loudspeakers. The best way to experience this is with a demonstration.
The Ginensky Project
Steve Ginensky of Array Control Technologies, Inc. coordinated a demonstration/investigation to quantify the benefits of extreme pattern control (beam-steered line arrays) in the Chicago-area in early February. The event was held at Techny Towers, a large, statistically reverberant chapel that was accessible for the 3-day event. Ten different sound sources were tested at six different microphone positions. The sources included 7 active beam-steered arrays and a passive array. The field was rounded out by an Outline GlobeSource “dodecahedron” source and an NTI Talkbox “talker-like” source. These would serve as a reference for evaluating the benefits of high directivity. 
Photo 1 – The omni source and subwoofer provide a reference for the STIPA with no source directivity.
Photo 2: The house system (left) and the location of the DUT.
Attendance was by invitation-only, as we wanted to keep the body count and ambient noise to a minimum. The arrays were alternately placed at the same physical position for the listening tests and measurements. Each was configured by a representative from its respective manufacturer. The details of the measurement systems, etc. will be described in a separate article. What follows is a description of my participation in the study.
Figure 1: The 1/1-octave T30 of Techny Towers Chapel
So Why Was I There?
It worked out that I was in Chicago anyway to conduct in-house training class at Shure. I just had to show up three days early to attend the array study event. Steve needed some low Q sources as a reference, which I was happy to provide. My objectives were: 1. Compare test results from three mainstream STIPA meters. 2. Collect Room Impulse Responses (RIR) for each measurement position. 3. Produce RT, C50 and STI data from the RIRs for comparison with the STIPA results. 4. Produce a report with embedded WAV files that allows the event to be experienced by anyone with a personal computer. 5. Provide the RIRs for further evaluation and investigation. I chose to use three microphone positions, log-spaced at 20 ft, 40 ft and 80 ft from the sources. This results in a predictable direct field level drop with increasing distance, allowing interpolation for other distances.
STIPA Meters
Can speech intelligibility be assessed using a hand-held meter? The only way to find out is to compare. The STIPA meters were mounted on an arm (Photo 3) to allow easy movement between positions. The stimulus was generated using an NTI MR-Pro signal generator. The meters were the XL2 (from NTI – with STIPA option), the SM-50 (from Embedded Acoustics) and AudioTools (from Studio Six Digital – STIPA Pro option ).
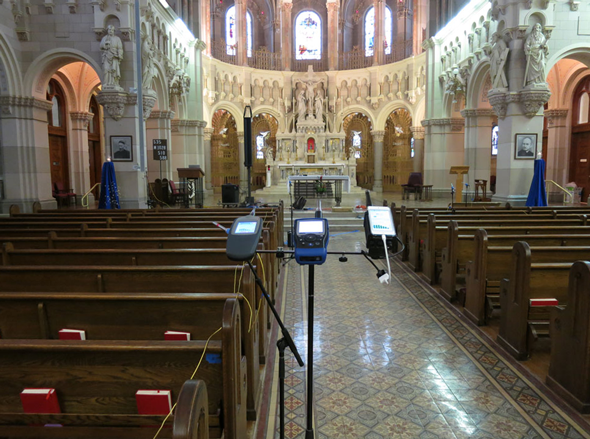
Photo 3 – The mounting rig for STIPA meter placement
Photo 4 – The STIPA meters at Test Position 2 (40 ft)
Many of you will remember Sander Van Wijngaarden of Embedded Acoustics from our Emergency Communication System Speech Intelligibility Workshop held in January 2013. Sander was the main theoretician on the workshop staff, and told us at that time of his pending STIPA meter. I received a beta for evaluation late last year, and this event gave me a chance to put it through the paces. Three measurements were averaged at each test position. The results in the PDF data matrix are from the NTI XL2. The Excel spreadsheet of the STIPA results is available here. STIPA_Matrix The Room
Impulse Responses
The log sweep recordings required for the RIR generation were made using using a tetrahedral microphone and 4-channel recorder, ultimately resulting in B-Format RIRs that can be post-processed into various microphone patterns and configurations. I have written much on this technique in the past (search the SAC website for “B-Format” and “Tetramic”). My recording hardware and post-processing methodology have not changed.
And the Results…
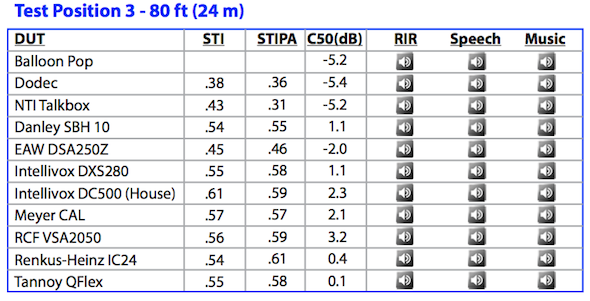
The results of the study are presented in a PDF file. It is a matrix that includes:
Device Make/Model
STIPA Test Result
STI (calculated from RIR)
C50 (calculated from RIR)
RIR (WAV file embedded for playback)
Convolution (Speech)
Convolution (Music)
Figure 2 – The data matrix (1 of 3) for Test Position 3
Lessons From the Matrix
Here are some things that can be experienced from the data matrix and a good playback system. Headphones are excellent for this purpose. 1. Direct-to-Reverberant ratio as a function of distance 2. Comparison of directional and non-directional sources in a reverberant space 3. The sound of any given array at three distances 4. Sonic comparisons of the various arrays in a noise-free environment There’s enough information here for a college course on acoustics, and that’s before deeper investigations using the individual RIRs. Using ReflPhinder, you can listen to other types of program material than the samples that I chose.
Photo 5 – My RIR listening station (a Bose Auditioner playback system). The PDF report and ReflPhinder are open on the PC. Just click to listen.
One Loudspeaker, Many Personalities
It should be remembered that what you are hearing/seeing in the matrix reflects the array AND its settings. Beam-steered line arrays have an infinite number of possible responses depending on how they are setup. Don’t pass judgement on any of the devices based on this one application. While we let the manufacturers setup their own arrays, it is still possible to have a different response if a different set of settings are used. The Danley SBH 10 is a passive device, so what you hear is what you get.
Conclusion
To understand the full significance of the study and experience all of the lessons therein, you need to download the RIRs and listen for yourself. ReflPhinder is optimal for this purpose, as it calculates some acoustic measures (e.g. T30, C50) along with performing convolutions using the B-Format files as input. If you are using GratisVolver, you will need the XY Stereo RIRs (link below). In addition to the speech convolution, I included a music cut to help evaluate the array’s bandwidth – some full chords from a Chapman Stick (a very wide bandwidth instrument). Listen to the room’s reverberation “tail” and modal decay on the staccato chord at the end.
I’ll conclude with saying that I won’t draw any conclusions for you. Listen to the data matrix and form your own. The objective here was not a “shootout” between arrays, and treating it like that is missing the point. This was a chance to compare measured data with listening tests under controlled conditions with a variety of source types which is always an enlightening exercise. Ironically, the listening part is better with the convolutions than on site, as you can have more program source types, and you can be at the listening position alone. Even though the room noise was low, it is essentially non-existent in the convolutions. You didn’t miss a thing by not actually being there. pb
Download the Data Report as a PDF file (file size = 107 MB)
Note: You MUST use Adobe Acrobat to listen to the embedded WAV files!
Download the XY Stereo Room Impulse Responses (for use with GratisVolver and measurement programs)
Download the B-Format Room Impulse Responses (for use with ReflPhinder)


