More on Testing Loudspeaker Installations
by Richard Honeycutt
Testing Loudspeaker installations using a 1/3-octave RTA and it’s two major side-effects.
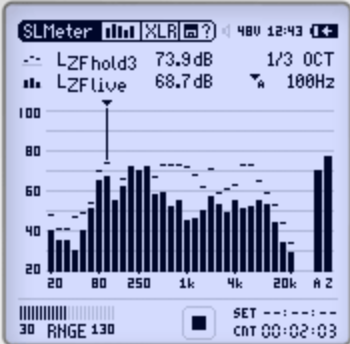
A 1/3-octave RTA is by far the most common tool used to evaluate sound-system output. Figure 1 shows a typical 1/3-octave RTA display. An RTA measures the system complete with all room effects. This has two major side-effects. The first is that in a small room, room-mode effects may be unrealistically represented compared to what a person would perceive in the room. The second side-effect is that the EQ adjustment must account for the frequency-dependent effects of reverb. In most rooms, the reverb time (RT) is shorter at high frequencies; thus, there is less high-frequency energy in the reverberant field. As a result, the RTA measurement shows less HF energy than the ear hears, since the ear/brain tends to subtract out a good bit of the room effects. So the EQ should be set with a gently falling response.
So what, exactly, is a “gently falling” response? A common quote from an unidentified acoustician of the past is that the response should be down 10 dB at 10 kHz. In the second edition of Sound System Engineering, Don Davis speculated that this acoustician was referring to the response 70-80 feet in front of a horn system, and indicated that the diffraction characteristics of the test mic at 10 kHz, the distortion in the sound system, and air absorption could play a role. Air at 20 degrees Celsius and 50% relative humidity has an absorption of about 0.25 dB/meter at 10 kHz. So at 70-80 feet from the source, air absorption would produce about 5.7 dB loss at 10 kHz.
Mic diffraction is inconsequential for sounds with random incidence—the usual case in a reverberant room. If the mic is within the critical distance of the speaker, it will receive significant on-axis energy, and high frequencies will be boosted. The onset frequency of this boost, and the amount of boost, depend upon the capsule diameter: for 1/4″ capsules, the boost is about 2 dB at 10 kHz, but for the older 1″ capsules used in the day of our unidentified acoustician, diffraction could have added as much as 8 dB at 10 kHz. The reason distortion could have affected his statement is that reducing the higher harmonics can make a distorted signal sound cleaner.
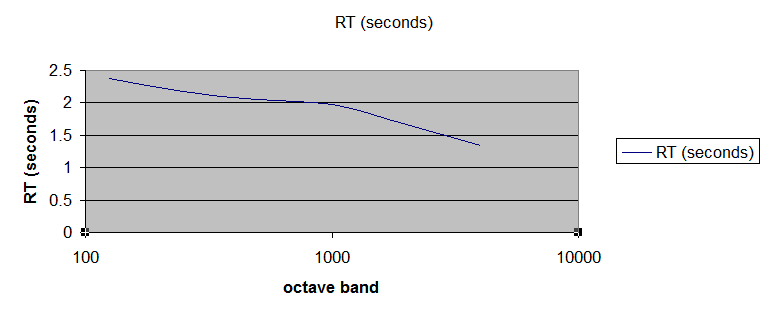
To all this, we have to add the effect of the high-frequency-poor reverberant field. Figure 2 shows the RT of an occupied church fellowship hall. Note that the RT decreases at high frequencies, as is typical, because of most materials absorbing more sound at HF than at LF. Thus the response deep in the reverberant field will have proportionately lower HF content than will the response in the direct field. So if we’re measuring at the rear of the room, our measurements will show a flat system to be deficient in HF.
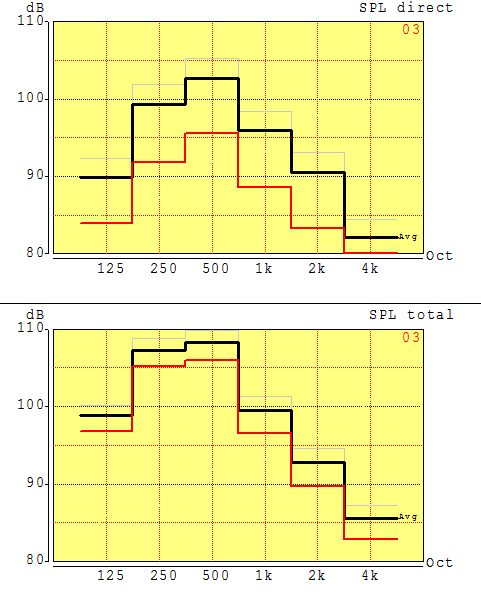
Figure 3 shows the CATT prediction of direct and total octave-band responses of an unequalized sound system in an occupied church fellowship hall. The grey plot represents a listener position close to the front; the red one shows the response at a rear listener position.
At 4 kHz, the difference between direct and total response at front is about 2.5 dB. At the rear, that difference is about 3 dB. Thus the greater proportion of reverberant energy at the rear only increases the loss by about 0.5 dB at the rear at 4 kHz. Further analysis using other CATT tools reveals that at 10 kHz, the reverberant field is responsible for about a 3-dB drop in the rear. In this particular case, the front and rear positions are 55 feet apart, which should indicate about 5 dB drop in the rear due to air absorption. (The direct response shown in Figure 3 is actually about 4 dB lower in the rear, and part of this difference is due to “spreading loss”.) Air absorption will affect direct and reverberant responses similarly, but a reverberant sound “ray” that has traveled a long distance before reaching the mic will experience relatively more HF loss.
So the bottom line is that if we’re measuring at about 50-60 feet from the speaker, in order to compensate for air absorption and the effect of the reverberant field, plus any mic-diffraction effect using the common 1/4″ test mics, we should adjust the equalizer so that the response at 10 kHz is about 5-9 dB lower than the midband response. At shorter distances, or in deader rooms (less reverberant energy to change the reading), the correction should be less. If you keep your biological test mics calibrated by listening to good acoustic music frequently, you can use them to judge where in the 5-9 dB range you want to end up. If we are using very good speakers aimed properly, this response may well take care of itself, since little HF EQ is usually need in such cases.
In a future blog, we’ll look at the comparison between FFT and octave-band measurements, using some examples. rh
 Richard A. Honeycutt developed an interest in acoustics and electronics while in elementary school. He assisted with film projection, PA system operation, and audio recording throughout middle and high school. He has been an active holder of the First Class Commercial FCC Radiotelephone license since 1969, and graduated with a BS in Physics from Wake Forest University in 1970, after serving as Student Engineer and Student Station Manager at 50-kW WFDD-FM. His career includes writing engineering and maintenance documents for the Bell Telephone System, operating a loudspeaker manufacture company, teaching Electronics Engineering Technology at the college level, designing and installing audio and video systems, and consulting in acoustics and audio/video design. He earned his Ph.D. in Electroacoustics from the Union Institute in 2004. He is known worldwide as a writer on electronics, acoustics, and philosophy. His two most recent books are Acoustics in Performance and The State of Hollow-State Audio, both published by Elektor.


