Pat’s Measurement Glossary
By Pat Brown
Pat Brown put together a glossary for the audio practitioner. In includes some of the most frequently encountered terms when working with audio analyzers.
Download a PDF of this article.
In my lifetime, the size of sophisticated audio analysis systems has evolved from table top, to under-airplane-seat, to computer bag, to cell phone. The cost has evolved from the price of a nice automobile to that of a Happy Meal. As such, there are more audio practitioners than ever equipped to perform sophisticated loudspeaker and room measurements. Those who make the decision to get serious about this are faced with the daunting task of learning the ropes in order to get meaningful data from their measurement platform.
It comes down to signal processing, and the theory and principles are not unique to audio and acoustics. They are used by virtually every engineering field, and even spill into seemingly non-technical fields such as accounting and photography. Audio practitioners use software and hardware tools with deep signal processing roots.
The good news is that textbooks and websites regarding every part of the measurement process are plentiful. The bad news is that you can Wikipedia-yourself until kingdom come and never cover it all. You will also find that the rigid definitions may not even seem to apply to audio, since they were not developed to measure audio systems. In many cases they are presented in the most concise form possible – as mathematical equations.
I decided to cook up a glossary of some of the terms most frequently encountered when working with audio analyzers of all types. Since acoustic analyzers analyze audio signals, this glossary applies to them, too. I have relaxed the rigidity to communicate the concepts, resulting in definitions that, while less general, are more applicable to how audio practitioners use them. It is my hope that this will help you better understand your measurement platform of choice.
As one engaged in both web-based and in-person training, I have the benefit of observing first hand how those new to the field wrestle with these principles. I get lots of questions on a daily basis. I learned long ago that “What one is wondering, many are wondering.” In the future I can refer the investigator to this document when they are wrestling with getting meaningful data from their measurement platform.
These are ordered in a way logical to learning measurement from the ground up, starting with general terms and then including the more esoteric. I wrap with a concise description of a real-world measurement session, using all of the terms from the glossary. Here we go…
General Terms
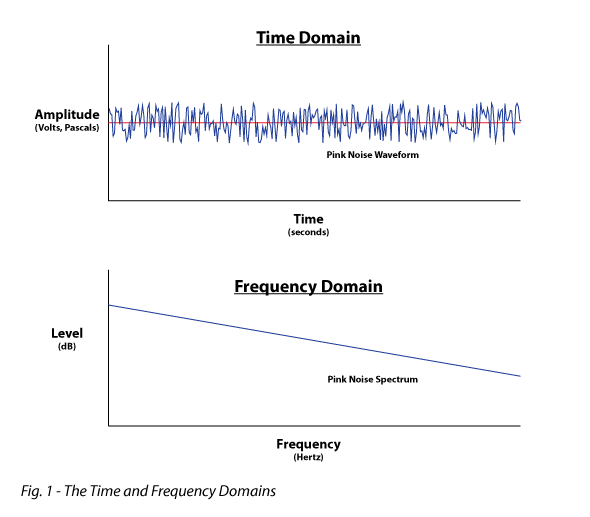
Signal Domain – The X-axis (horizontal) of a 2D plot of an audio waveform, usually a captured impulse response (IR). The strength of the signal is plotted on the Y-axis, either in linear units (pressure or voltage) or as a level in dB. The two domains most often used to analyze signals are the time domain and the frequency domain (Fig. 1).
Fast Fourier Transform –FFT – A mathematically efficient algorithm for determining the spectral content (frequency domain) of a time domain waveform. In measurement work, the FFT is usually performed on the impulse response (Fig. 2).
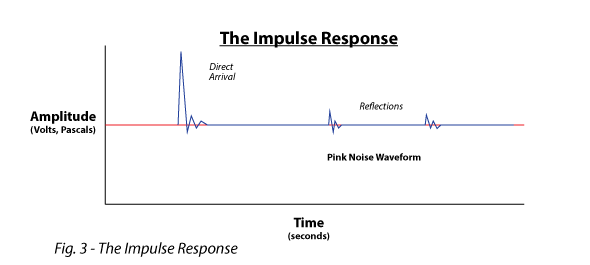
Impulse Response (IR) – A display of the signal amplitude vs. time of an impulse that passes through the system. Acoustic examples include handclaps and balloon pops in a room. It is the inverse-FFT of the transfer function, which can be captured using non-impulsive stimuli (e.g. pink noise or log sweep) (Fig. 3).
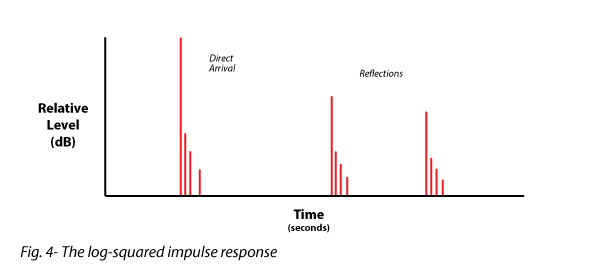
Log-Squared Impulse Response – A time domain plot that results from rectifying the IR and displaying it on a log vertical axis. It displays the relative levels of the various events, making it easier to judge whether or not an event is significant (audible) (Fig. 4).
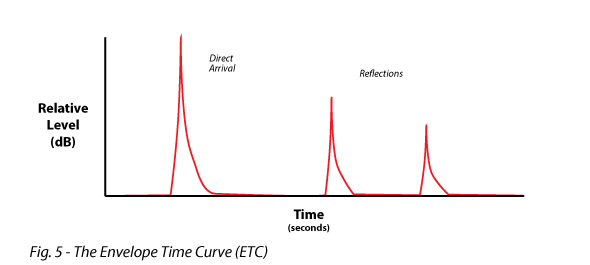
Envelope-Time Curve (ETC) – Formerly the Energy-Time Curve, it displays the envelope of the impulse response. It is a sort of “smoothed” log-squared response, and can aid in interpreting it. Note that the term “ETC” is used loosely in measurement, and its exactly meaning is specific to the analysis platform (Fig. 5).
Time Window – A technique used to limit the application of the FFT to only part of the impulse response. This yields the transfer function for only part of the time record. A time window can be used to reduce the effects of room reflections on the transfer function, effectively allowing anechoic loudspeaker measurements to be made indoors.
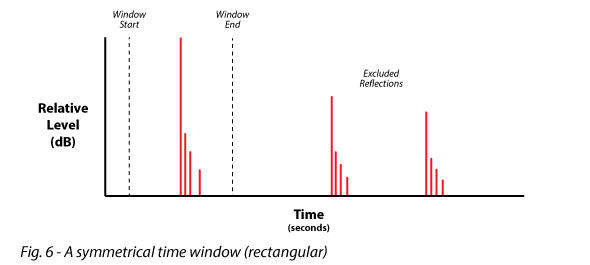
Symmetrical Time Window – Symmetrical time windows are used when there is significant energy on both sides of the direct sound arrival of the impulse response that must be rejected from the FFT. It is usually centered around the direct sound arrival (Fig. 6).
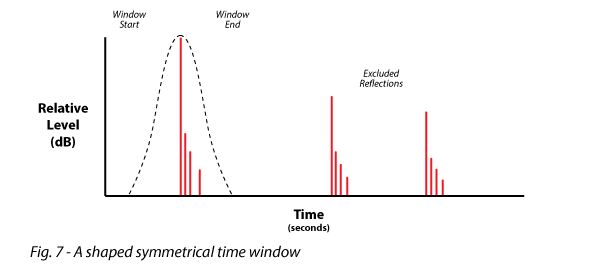
Shaped Time Window – A time window that is tapered at its edge(s) to avoid abruptly interrupting the time domain data. A symmetrical time window is tapered at both ends. There are various time window “shapes” available (e.g., Hann, Hamming, Blackman-Harris, etc.) (Fig. 7).
Half-Window – A time window that is tapered on the trailing edge only. Half-windows are used when the impulse is near the start of the time record, where there is very low energy ahead of the impulse arrival. Here the use of a symmetrical window is either unecessary or it could exclude the direct field arrival (Fig. 8).
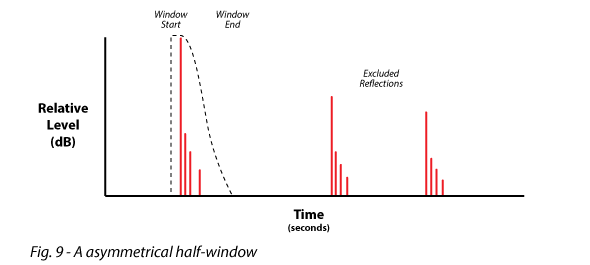
Asymmetrical Time Window – A time window that is not tapered (rectangular) at the leading edge, but tapered at the trailing edge. The leading edge of an asymmetrical time window must always be placed before the impulse arrival (Fig. 9). The leading edge of a half-window can be placed after the arrival of the impulse (Fig. 8). The half-windows implemented by many analyzers are actually asymmetrical windows, and you will not find universal agreement on which is the “correct” implementation.
Dual or Multi-Time Windows – The use of more than one time window length. This allows the room reflections to be excluded from the high frequency response, but allows the room into the measurement for computation of the low frequency response. This appears to emulate the way that humans perceive sound. In effect, at low frequencies (long wavelengths) the contribution of the room reflections become part of the woofer’s response, and cannot be separated from it, either by the listener or the analyzer (Fig. 10).
In general, symmetrical time windows are used by analyzers that collect the real-time transfer function. Half-windows are usually used when the operator manually selects the portion of the impulse response to be transformed to the frequency domain (using cursors). The objective of all window types is to produce a frequency response magnitude response that is free of comb filters (frequency response ripples caused by the phase interaction of multiple sound arrivals), leaving the part that can be meaningfully improved using an electronic equalizer.
Finite Impulse Response (FIR) – An impulse response of fixed time length. An example is a wave file of the IR of a room or loudspeaker, but it could also be a high or low pass filter used to form a crossover network.
Infinite Impulse Response (IIR) – An impulse response that is generated on-the-fly with feedback of previous sample values. In theory, such an IR would never decay to zero. Analog filters are IIR, as are some digital filter types. In general, IIRs have lower latency than FIRs.
Frequency Response Magnitude – A measure of the relative or absolute level of the signal vs. frequency. There is information about “how much” but not about “when.”
Frequency Response Phase – A measure of the relative or absolute phase of the signal vs. frequency. There is information about “when” but not about “how much.” In the vast majority of system tuning applications, the display is of the phase response relative to a time reference, which is usually the arrival of the direct sound field from the loudspeaker (its impulse response). This time reference is selected by the operator, or automatically determined by the analysis software.
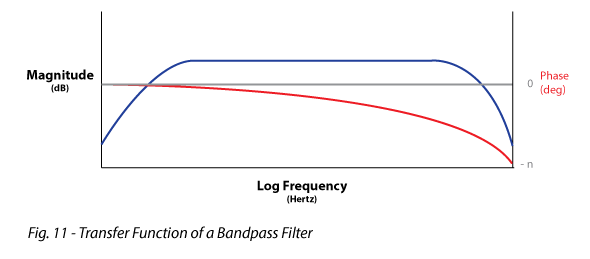
Transfer Function – A display of both relative magnitude and relative phase of the frequency response on the same plot (Fig 11). It is the FFT of the impulse response, and the IR is the iFFT of the transfer function. This allows the observe to exploit the strengths of either domain when analyzing the response.
Absolute Phase Response – The phase response displayed using “time zero” (the time origin of the signal) as the reference. It always begins at zero degree, and goes negative with increasing frequency. This is required by causality, which says that the signal cannot arrive before it is emitted. The absolute phase response can go negative by many thousands of degrees, depending on the “time of flight” of the signal between source and receiver. It is not very useful for measurement work, but is used extensively in computer room modeling, where the time relationship between virtual loudspeakers in a virtual space must be considered.
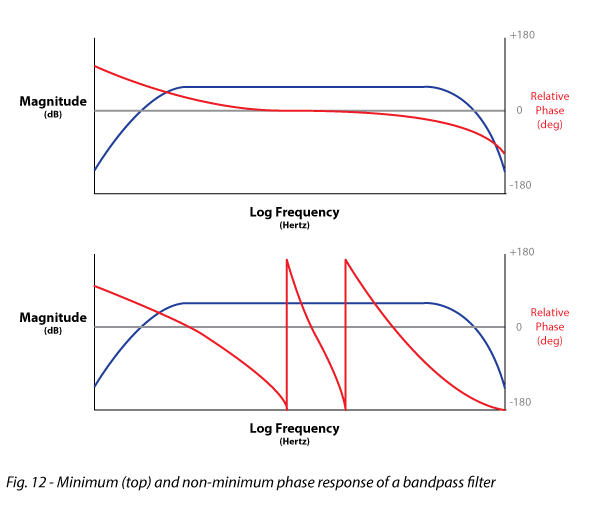
Relative Phase Response – The frequency response phase using a user-selected “time zero” which is selected to make the center frequency of the bandpass filter (e.g., loudspeaker) go through zero degrees at its center frequency. The “correct” time zero is the one that produces the least phase shift through the pass band of the filter. Unlike the absolute phase, the relative phase can go positive (Fig. 12). The relative phase response is an indicator of how well the system an preserve the shape of an audio waveform that passes through it.
Minimum Phase Response – A given magnitude response can have an infinite number of phase responses, depending on the frequency-dependent delay of the signal passing through the system. The minimum phase response represents the minimum possible phase shift for a given magnitude response. It can be calculated from the magnitude response using the Hilbert Transform. It serves as reference for comparison with the measured phase response of the system. Raw transducers are usually minimum phase.
Non-Minimum Phase – Phase shift in excess of the minimum phase response for a given magnitude response. Loudspeakers with analog or IIR crossover networks are often non-minimum phase (Fig. 12).
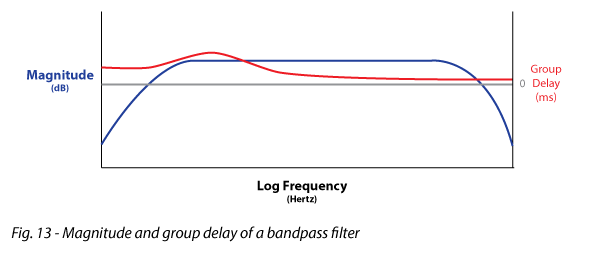
Group Delay – A “joint domain” display of time (y-axis) vs. frequency (x-axis). The phase response can usually be displayed as “group delay” to make it more intuitive for determining the arrival times of various chunks of the spectrum (such as the woofer or tweeter response)(Fig. 13).
Linear System – A 1:2 increase in the input signal level produces a 1:2 increase in the output signal level. Compressors and limiters are non-linear, and should be bypassed for measurement work.
Time-Invariant System – The response of the system under test is stable vs. time, making the measurement exactly repeatable. Moving the loudspeaker or mic during the measurement would produce time variance.
Since the Time and Frequency domains are mathematically related in an inverse way (for linear, time-invariant systems) the weaknesses in one domain can become strengths in the other. For example, the time domain is more useful for looking at “when” but the frequency domain is more useful for looking at “what.” Most analyzers let you toggle back and forth between the time and frequency domains, and some display both simultaneously.
TF = 1
F = 1/T
T = 1/F
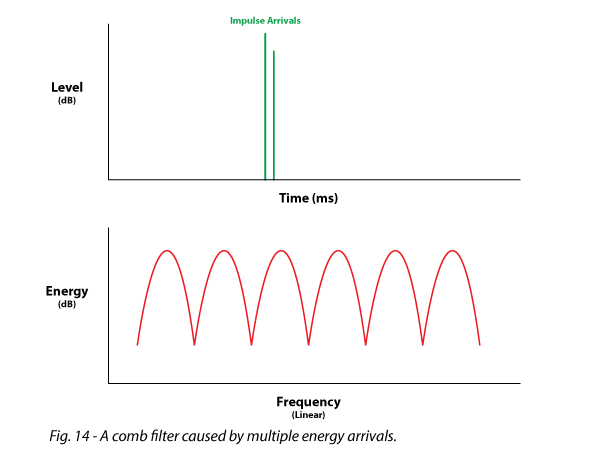
Comb Filter – A series of peaks and dips in the transfer function that are equally spaced in frequency. A comb filter is always result of multiple energy arrivals in the time domain, within the time window being observed. Since it is caused by the time/distance relationship between two sound arrivals, a comb filter will be unique at every measurement position. This makes the response impossible to correct by equalization (Fig. 14).
Analyzer Types
Now, some traditional, common-usage definitions of analyzer types and measurement methods:
Real-Time Analyzer (RTA) – Measures the frequency response magnitude in real-time. The data is usually octave-banded (or fractions thereof) and results from pink noise being played through the system. There is no phase data, so this response is “time blind.” The RTA displayes the magnitude of each 1/n-octave band, but nothing about their time relationship. An RTA measures the stimulus along with how it is modified by the loudspeaker and room. Early RTAs were basically a bank of sound level meters driven through fractional-octave filters. Modern RTAs measure in the time domain and compute the spectrum using the FFT. The data can optionally be octave-banded for display. This emulates the traditional RTA.
RTAs are the simplest “frequency analyzers” to use. Just place the mic, excite the system, and observe the response. But since the measurement is blind to the arrival time (and direction) of the sound, the observed response may have little to do wit what a human perceives when listening at the same position.This is an aspect of measurement that the more sophisticated measurement processes attempt to address.
Dual-Channel FFT – Measures the impulse response (or transfer function) by comparing the signal fed into the system to the signal re-acquired through the measurement microphone. A dual-channel FFT measures what happened to the reference signal, not the signal itself. As such, many different broadband stimuli can be used (even music).
Discrete Method – The system is excited with a stimulus, and the resultant IR is manually time windowed (by the placement of cursors to mark the window edges) and the transfer function observed. Each is a discrete step. If I make changes with an equalizer, I will need to repeat the measurement to observe the effect of the filter.
Real-Time Transfer Function – The process of collecting the time domain signal, comparing it to the reference signal, time windowing, and FFT-ing to the frequency domain, done at such blinding speeds that the transfer function is given in pseudo real-time and updated continuously. It is a “running” measurement that can allow system tuning to be performed during a show. The effect of filtering is immediately seen and heard, since the measurement is ongoing.
Coherence Plot – A frequency domain plot used with the real-time transfer function that indicates the likelihood that the observed response is valid, based on the input and output signals of the system. High coherence suggests good data. For the discrete method, repeatability is the “acid test” for good data.
Stimulus Types
White Spectrum – A stimulus with equal energy per Hz. Examples include an impulse, white noise and linear sine wave sweeps. White spectra have energy that increases with frequency (since there are more “Hz” in the higher octaves than the lower ones), and typically yield poor signal-to-noise ratio at low frequencies (Figs. 15 and 16).
Pink Spectrum – A stimulus with equal energy per octave. Examples include pink noise and log sine wave sweeps. A pink spectra voltage contains more low frequency energy (and less high frequency energy) than an equivalent white spectra voltage. Most general sound system testing methods utilize pink spectra.
Narrow Band Stimulus – A stimulus having limited spectral content, such as a sine wave (Fig. 15).
Broad Band Stimulus – A stimulus having broad spectral content, typically covering the entire audible spectrum. Examples include unfiltered noise and impulses.
Putting It All Together
Here is an example of how all of the terms in the glossary might be used to describe the measurement process used for sound system tuning session:
I wish to improve the frequency response of my loudspeaker through equalization. I will collect the impulse response using a pink spectrum signal (pink noise or log sine sweep), fed into the system from the sound card output of my dual-channel FFT measurement platform. This signal is also looped back into one of the inputs, allowing the analyzer to compare it to the signal picked up by the measurement microphone. The resultant IR is displayed as a log-squared response to better visualize relative levels of the sound energy arrivals. I bypassed the compressor/limiter blocks of my DSP, to assure that the system response is linear. The mic was placed on the floor plane, and I made sure that no one was moving near the mic or loudspeaker. This, along with turning off the ceiling fans assured that the system was time invariant. A time window is placed around the direct arrival, to exclude room reflections. Performing an FFT produces a transfer function that is free of comb filters. A shaped time window is used to avoid an abrupt interruption of the time domain signal, and the resultant anomalies in the frequency domain. Equalizer filters are placed on bumps in the frequency response magnitude. Since these bumps are minimum phase, the equalization process also improves the loudspeaker’s phase response. The phase wrap at crossover of the 2-way loudspeaker is non-minimum phase due to the IIR crossover filters used in my digital signal processor. I have to live with it. The phase response could possibly be improved by using FIR digital filters, at the expense of increased overall group delay. Since I am tuning the system before the event, I am using a discrete measurement method. While any broad band stimulus could be used, I will use one with a pink spectrum so as to provide equal energy to the system in each octave band. This assures that I don’t smoke my tweeters while trying to energize the subwoofer. Later, I will monitor the response during the event using a real-time transfer function to assess the effect of the increased absorption presented by the audience as the room fills up. Since my earlier measurements used a mic placement that ignored the floor reflection, minimal adjustment of the equalizer is needed for “audience compensation.” The coherence plot indicates whether the data can be trusted. It is needed because the spectrum of the music signal is continuously changing, and there may be time variance caused by people moving around.
Conclusion
That’s a general overview of the terms and their application. The principles are universal and apply to all measurement platforms. Some of the definitions were slanted toward their general use in audio and acoustic measurements. As with all theoretical concepts, some of the definitions could be challenged on the fine details, especially with regard to their general use outside of audio and acoustics.
That’s one of the reasons that I love this business. pb
Download a PDF of this article.

