A Closer Look at Loudspeaker Coverage Angles
In this article, Jeremy compares the coverage angles of 3 full range loudspeakers 90°x40°, 90°x50° and 90°x60°.
Most loudspeakers used in sound reinforcement have some sort of Pattern Control Element (PCE – a new term I just coined and will use for the remainder of this article. We need more acronyms in the audio industry…). A PCE is incorporated to confine the sound to a predetermined area or section of a sphere. These PCEs are commonly referred to as “horns” or “waveguides” – two terms that are often used interchangeably and for which no clear distinction exists (that I have been able to find). The physical size and shape of the PCE is directly related to the range of frequencies it can guide or direct. The larger the device, the lower the frequency it can control. This is fully predictable by physical laws.
I took three full range loudspeakers with specified pattern control of 90°x40° to 90°x40° and compared them to one another. The 90°x50° pattern range is very common and widely used. For the purposes of this experiment it is not important to know the manufacturer of these devices so I won’t tell you. The main point to be illustrated is that the physical size of the device has significant impact on its ability to control sound radiation.
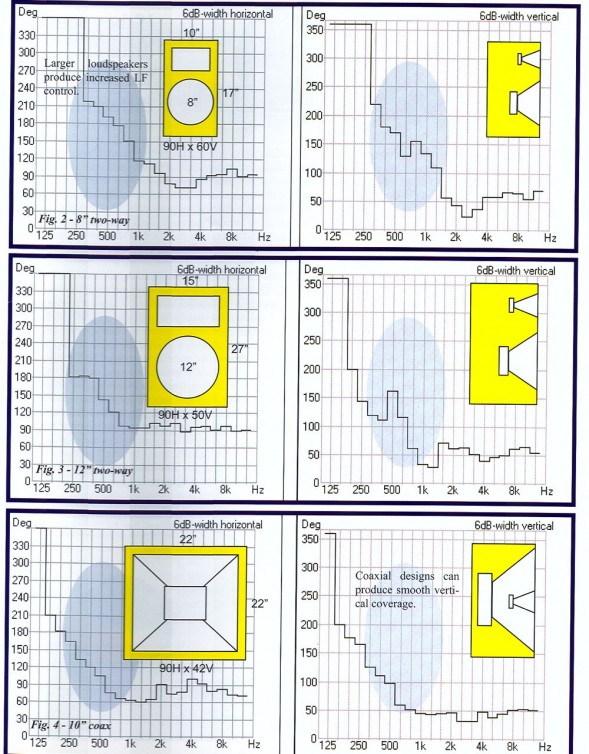
The three loudspeakers I selected represent a good cross section of available loudspeakers in the marketplace. One is a small 8” two-way loudspeaker, approximately 17” tall and 10” wide; it’s pattern is specified as 90° horizontal by 60° vertical. The second loudspeaker is a 12” two-way loudspeaker with a specified pattern of 90° horizontal by 50° vertical. It is approximately 27” tall by 15” wide. The third loudspeaker is a 10” two-way, coaxial horn-loaded loudspeaker. It is approximately 22” tall by 22” wide with 90° x 42° pattern. Each loudspeaker has a horizontal coverage angle specification of 90 degrees. The specified vertical coverage angle for each loudspeaker is similar, but not identical. They are sufficiently similar to illustrate the concepts from above. The accompanying graphs illustrate the width of the coverage pattern for each box as noted. They are all scaled identically to show the reader how the physical size of the PCE impacts the width of its pattern. Also shown is a conjured- up ideal loudspeaker (Figure 1) with perfect 90°x40° coverage in all frequency bands.
The beamwidth plots from the CLFViewer illustrate how the physical size of the loudspeaker affects its pattern control. There are many loudspeakers available with the same specified pattern control, but the designer needs to dig deeper to determine if the device is physically capable of maintaining the required coverage pattern.
Note that the benefit of larger loudspeakers is increased pattern control for the low-midrange (250Hz and 500Hz octave bands – highlighted in the plots). While small loudspeakers can radiate useful energy in this region, they do not offer as much control over where it goes. Sound system designers often try to maintain pattern control through the speech range, which suggests the need for useful control down to 250Hz. It can also be seen from the plots that coaxial design offer benefits in directivity performance through the crossover region, resulting in smoother vertical radiation, assuming that the other caveats of this technique are addressed by the designer.
All of this serves as one more example of the useful information that can be extracted from good loudspeaker balloon data. It also shows why plots are better than numbers when it comes to describing loudspeaker specifications. jj


