SynAudCon Newsletter – Volume 3, Number 2, January 1976
Newsletter
VOLUME 3, NUMBER 2
January, 1976
© Copyright 1976, Don Davis
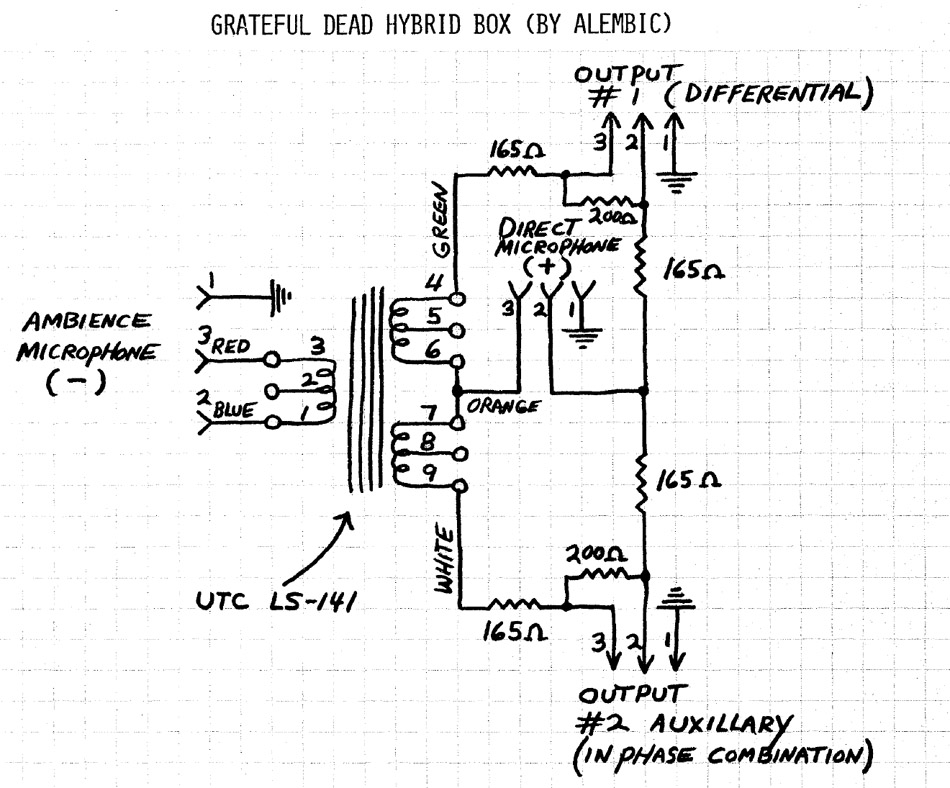
GRATEFUL DEAD HYBRID BOX (BY ALEMBIC)
PRINTOUT FROM A TIME SHARE COMPUTER
From Sam Bridges, Electronic Design Co., Minneapolis Class 1973, ’74, and ’75:
Don Davis’ answer to Sam Bridges:
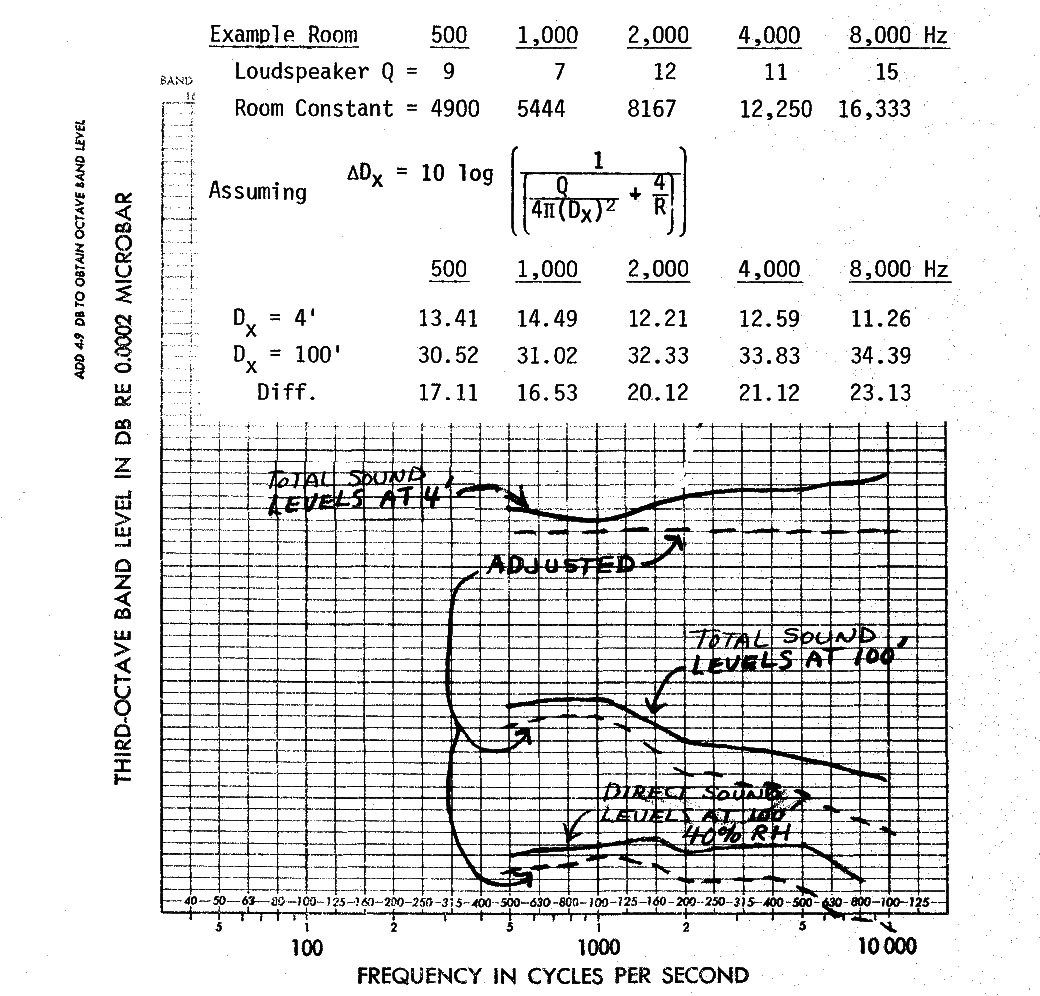
In reading thru your objections to the so-called “audience preference curve” I came up with the following comments:
1. The reverberant sound field is dependent only upon the PWL and is in no way dependent on the Q. Raising Q can allow the PWL to be lowered, thus lowering the reverberant field while maintaining the desired ratio of direct-to-reverberant sound.
2. The direct sound field, at say 100 1, Ox » Dc’ has a shape quite similar to the reverberant field response (direct sound cur~e due to inverse square law and air absorption.)
3. I believe the majority of us agree that the closer one sits to the sound source the more uniform the response can be at high frequencies, and the sound is good.
4. Cecil Cable has shown with time delay spectrometry that the direct sound field and the reverberant sound field usually have the same relative response characteristics at any given point but that the relative response of the early reflections can be quite jagged.
We are most interested in any experimental work you undertake in your auditorium and would be del ighted with a report on it.
I am sending a copy of your letter to Cecil Cable for his comments.
From Cecil Cable, Edmonton, Alberta, Los Angeles class 1973 and 1974
Back in October you sent me a copy of some thoughts from Sam Bridges, re: “Audience Preference Curve”. This is another subject which can stand some investigation. I believe your illustration of a typical room is substantially correct. I also agree with the general philosophy of Sam Bridges – when measurements are taken in the reverberant field. I think that this is not in disagreement with Schuleinls work, JAES Apr/75. As I understand it, the conclusion of Schuleinls work is summarized in Fig. 13,14, and 15, Page 183 of the Journal. Although his experimental work in establishing the audience preference curve is most convincing, the conclusions, I believe, are based upon the existence of sound fields which are not fully defined.
Schulein says you must starve the reverberant sound field at high frequencies because of the greater sensitivity of ears to the diffuse field at these frequencies. Sam says the reverberant or diffuse field is deficient because of higher Q’s and lower power at high frequencies. Your curves agree. Sam is suggesting that human judgment is based upon the direct field – not the diffuse field – even though the direct field may not be predominate. Schultz: IIAcoustics in the Concert Hall II , IEEE Spectrum, June 1965, suggests that the direct field may be starved at low frequencies as long as the reverberant field is balanced – that at lower frequencies, judgment is based on the reverberant field. He says nothing about the same thing being true at high frequencies.
I have looked at system equalization based on the direct sound alone – easy to do with Time Delay Spectrometry. However, those sources I have had to work with have been incoherent, giving direct sound so jagged, dependent upon polar position, that I have concluded such equalization would be good for that auditor position only.
If I had my druthers, I would use some sort of averager to take direct sound from a number of polar positions, so that the nulls and maximums would average out, or at least become spaced closer than 1/3 octave. I believe that unless Sam uses a coherent source (like the elusive point source), and uses relatively broad band signals, (not sine wave) for his pulses, he may find as many different direct sound spectrums as he has room positions.
The very fact that most sound reinforcement situations do present very jagged spectrums of direct and early sound makes one wonder if it is really this ‘spectrum we make our judgments on. The late and reverberant field are even more jagged, spectrum wise, but the deviations in level are closely spaced, much closer than 1/3 octave, so are averaged out through the approximate 1/3 octave critical bandwidth of the hearing mechanism. It is this “smoothed””response curve we usually equalize.
Within the terms of Hopkins and Stryker (upon which most of our equations concerning R are based) I cannot allow that reflected sound is separate from the reverberant field. R includes all boundary reflections from the first to the nth. However, we do know that early reflections – say the first 10 dB of decay – are more significant than the subsequent decay.
Within the terms of Hopkins and Stryker (upon which most of our equations concerning R are based) I cannot allow that reflected sound is separate from the reverberant field. R includes all boundary reflections from the first to the nth. However, we do know that early reflections – say the first 10 dB of decay – are more significant than the subsequent decay. In the stricter sense of Q I would like to see the early reflections from the floor from his “loudspeaker with a Q of 2”, defined as early reflections of the reverberant field, rather than being assigned to the source as adding to the direct sound. This would then yield a loudspeaker Q of less than 2 over large portions of the hemisphere ( but would not deny the possibility of high Q’s over smaller portions of the hemisphere.
Both Schulein’s and Sam’s observations (and yours as well) assume a loss in the ratio of direct (and early?) to reverberant sound as D2 increases. If we use loudspeaker Q’s, such that a maximum uniform ratio of direct to reverberant sound obtains for every auditor, there is no change in this ratio with a change of 02 or of Ox. To me, or speech at least, this seems to be a desirable situation. It would then be in only relatively reverberant rooms that the HF loss of the reverberant field (Sam’s) or the greater HF sensitivity of hearing response to the reverberant field would become significant.
With the new horns Don Keele is turning out and the equations to define the required Q to lay down uniform fields, such a hypothesis does not seem too unreal.
And, from Dave Klepper, KMK Associates, New York 1975 class, on a slightly different, but related subject.
I agree that Alan Lubell’s Tech Topic is a good start on directivity. (Volume 3, # 2, “Applying the 5 & 10 Rule to High Q Acoustic Radiators”)
Frankly, I’m eager to do an interesting experiment. Today I believe that there is actually no limit on how high the reverberation time of a space can be, provided all listeners have line-of-sight onto the central loudspeaker cluster, and that central loudspeaker cluster has sufficient directivity. Is there a practical limit on directivity? I think the answer is no. Imagine a plane rectangular room with no sound absorption except you, the solitary listener. The reverberation time will be very high, with you the only absorption, perhaps as high as 40 to 50 seconds. Now imagine a horizontal line source extending from one side of the room to the other ( at the ceiling line. What is the Q of this line source? Well, in the vertical plane, it is probably only 2, resulting from the simple loudspeaker’s location on one surface. But, in the horizontal plane, the Q is infinite. The walls are flat and sound-reflecting, so a mirror image of the horizontal line source is present, extending the line source. A double reflection, including both walls, represents a further extension of the line source. The concept is much more difficult to describe in writing or by equations than by simply drawing it; but you can see that the continuous line source is virtually reflected on both sides to form an infinite line source.
What about the mean Q? Well, what about it? What would be the mean Q between 2 and infinity? I don’t have an answer to this question, but I’d like to perform the experiment, find out where critical distance is, and derive a mean Q from the distance. Of course, I would expect the SPL to falloff at only 3 dB/distance-doubling, rather than 6 dB, since we have an infinite line source. Also, I’d like to learn what the % ALCONS for that solitary listener is.
Suppose the articulation loss is too high, even with an infinite line source. Well, there’s ~~other trick up our sleeve. An infinite area source should be able to solve the problem. Imagine the end wall of our rectangular reverberation chamber completely filled with loudspeakers. (Of course, they are small loudspeakers, so that the end wall can be considered a truly plane source, and not a series of point sources.) Since the floor, walls, and ceiling are perfectly sound-reflecting and plane surfaces, again we have images of the plane source, this time in all four directions, as well as diagonally. The actual plane source and its mirror images would form a virtual infinite plane with infinite directivity. Critical distance would lose its meaning, because the only variation in level encountered in the reverberant room would be from the ( longitudinal standing waves; at high frequencies, as measured in one-third octave hands, there would be no change in level throughout the room.
Now I know that few rooms have perfect plane surfaces that are perfect reflectors. If they did, they would have other acoustical problems, independent of the sound system. But I do want to show that very high Q’s are theoretically and practically possible, by using the room as part of the loudspeaker system. And this leads me to believe that there is no limit on the reverberation time of a space, in terms of using a central loudspeaker cluster.
Indeed, the occasions where we have used some form of distributed system (Pew-back, column, or overhead) have not been the result of excessive reverberation per se. In each case, the distributed system was chosen because of one or more of the following reasons: (1) architect’s or owner’s objection to a large enough central cluster in the proper location, (2) large shadow zones behind massive pillars where a listener would lose line-of-sight on the central cluster, (3) some aspect of the church’s geometry that made a central cluster solution difficult. Your own experience includes churches with a high reverberation, higher than many would have thought a central solution to be possible, yet the central systems work.
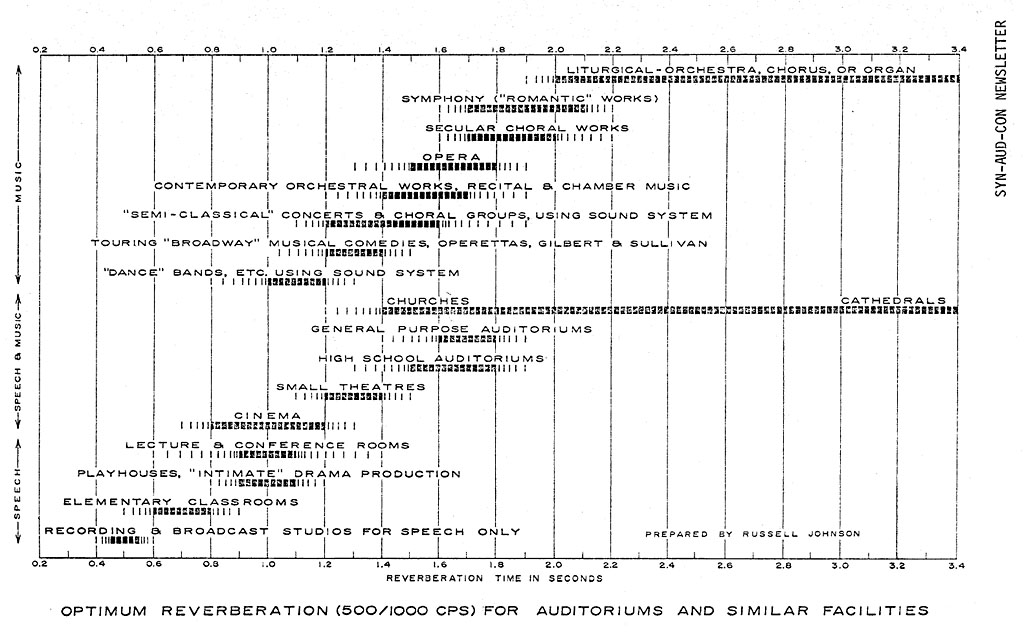 I am enclosing a copy of a chart prepared some years ago by Russell Johnson, then with BBN, but now with his own firm in New York. We believe that this chart demonstrates our actual practice much better than the reverberation time criteria curves in older text books.
Actually, we don’t set a design reverberation time goal for a new theatre, auditorium, concert hall, or church, without intensive discussions with the users and owners, to bring out all their feelings concerning the kind of space they want.
Now for brief answers to your specific questions: (Ed’s Note: We asked Dave to write up some material that we felt would be of special interest to Newsletter readers.)
1. The reverberation time of high-volume spaces should be higher than low-volume spaces, because the sound quality should complement the visual quality. In Russ Johnson’s chart, cathedrals (and this includes churches that look like cathedrals) should have reverberation times of three seconds (occupied) or over, while smaller churches can have reverberation times as low as two seconds (with a strong liturgical music program) or even lower, 1.4 seconds, if the emphasis is on speech. A smaller concert hall may have a reverberation time of 1.8 seconds, while a larger one probably should be around 2.0 or 2.1. Fan-shaped halls usually require rear-wall treatment and unfortunately have lower reverberation times; but there are exceptions, like the excellent Tanglewood Music Shed. Also, churches with A-frame construction (short side walls and highly-peaked roofs) often look deceptively high and often sound drier than a visual inspection would suggest. Otherwise, referring to’ Russ’s chart can be helpful in establishing reverberation time goals for many spaces.
2. We use the Sabine equation for all large churches, concert halls, theaters, and auditoriums; and we find our predictions realized in the field. Most of the sound absorption in such spaces results from the audience, and we use Table VI, page seventeen of L. L. Beranek’s “Audience and Chair Absorption in Large Halls II”, JASA Vol. 45, No.1, pages 13-19 for audience, upholstered seats, plaster, and thin wooer. These are all per-area coefficients. To this table, we add the information from the Acoustical Materials Association booklet (See Newsletter Vol. 3, no. 1, page 18 for address); and, since the proportion of applied materials in these large spaces is usually small, we do not worry about the differences between Norris-Eyring and Sabine coefficients in this application. We reserve the Fitzroy equations for odd rooms having the absorption in only plane or two parallel opposing planes, and rectangular or cubical construction. The only time we use per-unit sound absorption is when there will be just a few unit sound-absorbers or people in a room.
3. As noted in preliminary discussion, we doubt that there are practical limits to the length of reverberation that can mate with a central sound system, if the sound system designer can work with the architect and/or owner in providing a central system with enough radiating area and resulting directivity.
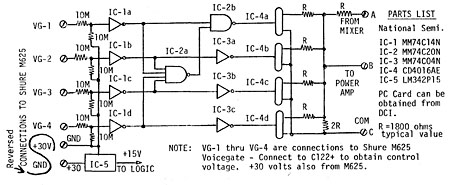
NOMA – NUMBER OF OPEN MICROPHONES ATTENUATOR — CORRECTION
From Phil Clark and David Torrey, Diversified Concepts, (Phil in Syracuse class, 1973, ’74 and ’75; Dave in 1974 and ’75 Syracuse class)
We discovered an error in the original NOMA writeup (Newsletter Volume 12). The +30V and GND connections are reversed. See drawing below.
Since the original publication of this note, we have been requested to construct 8 input and 20 input versions of this unit. Since the odginal board work was for 4 ‘inputs, we had to stack either’ two or five boards modified to accomplish the task..
Completely assembled and tested boards figure out to cost as follows: NOMA-4 $60; NOMA-8 $100; NOMA-12 $140; NOMA-16 $180~ and the NOMA-20 $220. Costs would drop. if we could make up more boards at a time, OT course.
Diversified Concepts, Inc., 3920 New Seneca Turnpike, Marcellus, New York 13108
OCTAVE BOOST FILTER MEASURED
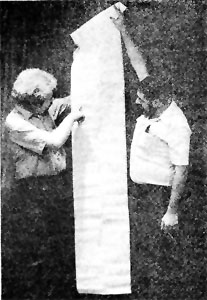
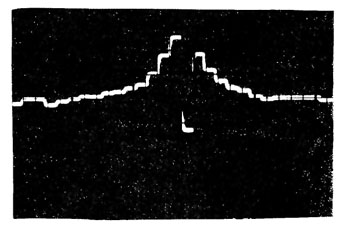 Bill Peterson brought into the DC class an octave boost-and-cut filter set. We often say in class that there are problems inherent in using a boost filter for sound reinforcement equalization. If the house curve shows a dip which proves to be a diaphragmatic absorption in the room, its easy to end up with 2 peaks in the sound system wnere previously you had a dip (and a dip is much easier to live with than a peak). If you are working with a real time analyzer, you can see it happening to you. Its when you are working “blind” that you can be fooled about what is happening to the house curve when you move a filter, especially in the boost position.
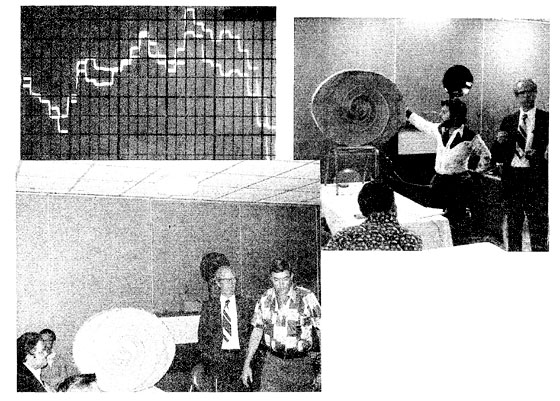
This photograph illustrates the problem. Using the GR 1/3-octave band pass equalizer we inserted a dip at 1,000 Hz, and boosted the octave equalizer at 1,000 Hz. Its easy to see what happened.
The first class that a 1/3 octave boost filter is brought in we will take a picture of the 1,000 Hz 1/3-octave filter on the GR real time in a cut position, and the 1,000 Hz filter on the 1/3-octave sound system equalizer in the boost position. We’ll publish the picture.
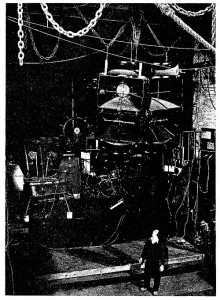
DISCO ARRAY
That’s Bill Peterson, Professional Sounds of Falls Church, 3-time D.C. graduate, standing under the horn array mounted to “antique” chains and ropes in a local Disco. Bill said the outstanding sound and coverage fron] the entire sound system was designed a la Syn- ( Aud-Con. It wasn’t figured on the back of an old envelope or from stock left over from another job.
Bill was in class this year with 3 of his men. The reason that he said he didn’t have more was because last year’s graduate, Steve Axthelm, and another of his men were providing sound for Jan Eden tour.
Speaking of Disco sound systems, John Larssen of Philips in Stockholm, Atlanta 1975 class, says that 90 dB is maximum SPL in Disco systems there!
From Andy Sobieralski, Gray Sound and Communications in Pittsburgh,
1973 Columbus class, 1974 Pittsburgh, and 1975 D.C. class.
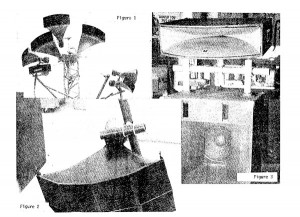 I’ve been introduced recently to a clever device, called Rota-Lock. and have use them quite successfully and economically on several installations.
In many sound systems the biggest design problem is the speaker mounting. The photographs shown here illustrate a convenient and economical approach to the trickier installations you may encounter.
In each of the examples shown, a device caned Rota-Lock, manufactured by Up~Right Scaffolds Company, 1013 Pardee Street, Berkeley, Calif. 94710, is used to fasten the horns. In examples 1 and 2, flat bar stock is welded to a short section of 2 inch standard schedule 40 pipe. Holes are drilled in the bar stock to coincide with the bolt holes in the driver/adapter. The entire assembly is fastened with hardened bolts. Figure 3 shows a mounting arrangement in a protective enclosure. Note in each ca~e the elevation and azimuth is fully adjustable. If the locking bolt is only sllghtly tightened, orientation can be performed with one hand – a particular advantage when holding onto a speaker tower or hanging from an auditorium’s grid work. Figure 1 shows a scheme for providing horn twist. Cut and reweld the bottom section of a vertical member at an angle. The twist angle may be adjusted from 00 to the angle of the pipe’s lower section by rotating the vertical pipe. The vertical pipe is also supported by a Rota-Lock.
The possibilities are limitless. Consider the ease of construction of a fully adjustable, stacked and splayed array for instance. The manufacturer’s literatur”e–h”as many application examples including storage racks, antenna mounting, theatrical rigging, etc., plus load bearing limits for standard sized pipe.
REGENERATIVE RESPONSE SPECIFICATION
Herb Chaudiere wrote the following specification clause for Regenerative Response equalization: (Robin Towne Assoc., Seattle class 1974)
The sound system equalization shall be adjusted using the Real Time Regenerative Response method.
Instrumentation required is a 1/3 octave band real time analyzer with associated measurement microphone and a pink noise generator. The pink noise generator shall be fed into an appropriate input of the sound system.
The sound system microphone gain shall be increased to a point just below sustained feedback. The pink noise signal shall then be increased to a point, beyond which the system will go into sustained feedback.
The measurement microphone shall be placed at a typical listening position and the house curve observed on the real time analyzer.
The system equalizer shall be adjusted to reduce those frequencies that have increased in amplitude relative to the overall curve as the system microphone gain and/or the pink noise signal were increased. Those frequencies that go into sustained regeneration shall be equalized first, followed by those that merely IIswell II as gain or pink noise level are increased.
I would like to add a couple of comments: The sound system microphone gain is adjusted so that approximately +2 dB more noise causes feedback or +2 dB more microphone gain causes feedback. When raising the noise input just a slight amount causes regeneration, the sound system microphone gain is about right. Occasionally you will want to pull down high bass portions right at the last that stay up in amplitude but never feedback.
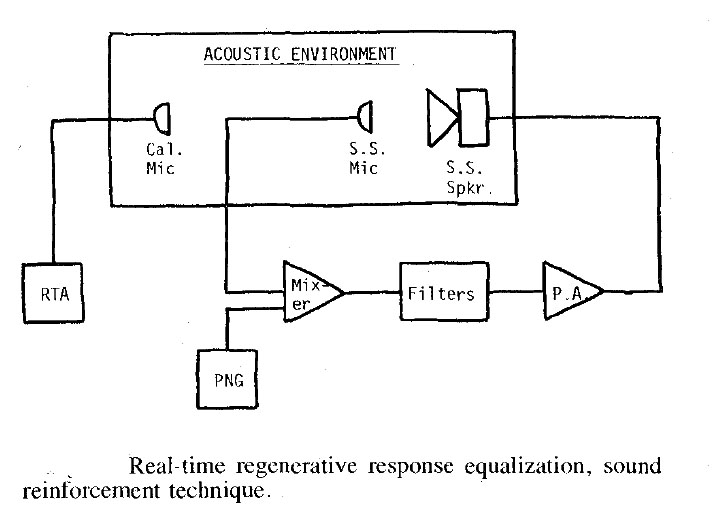
SCHEMATIC FOR REGENERATIVE RESPONSE
Through an oversight, the schematic for Regenerative Response Equalization was left out of Sound System Engineering, though text is complete. Syn-Aud-Con graduates since September 1975 will want to add the schematics (reproduced below) to pages 157 or 158 of the textbook.
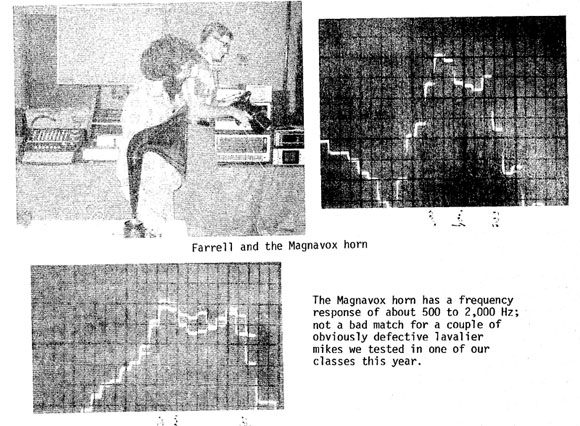
FARRELL BECKER’S ANTIQUE JEWEL
Farrell Becker of the 1975 DC class brought in an antique prize that he bought for $25 at a garage sale: A Magnavox horn with an electro-magnetic driver!
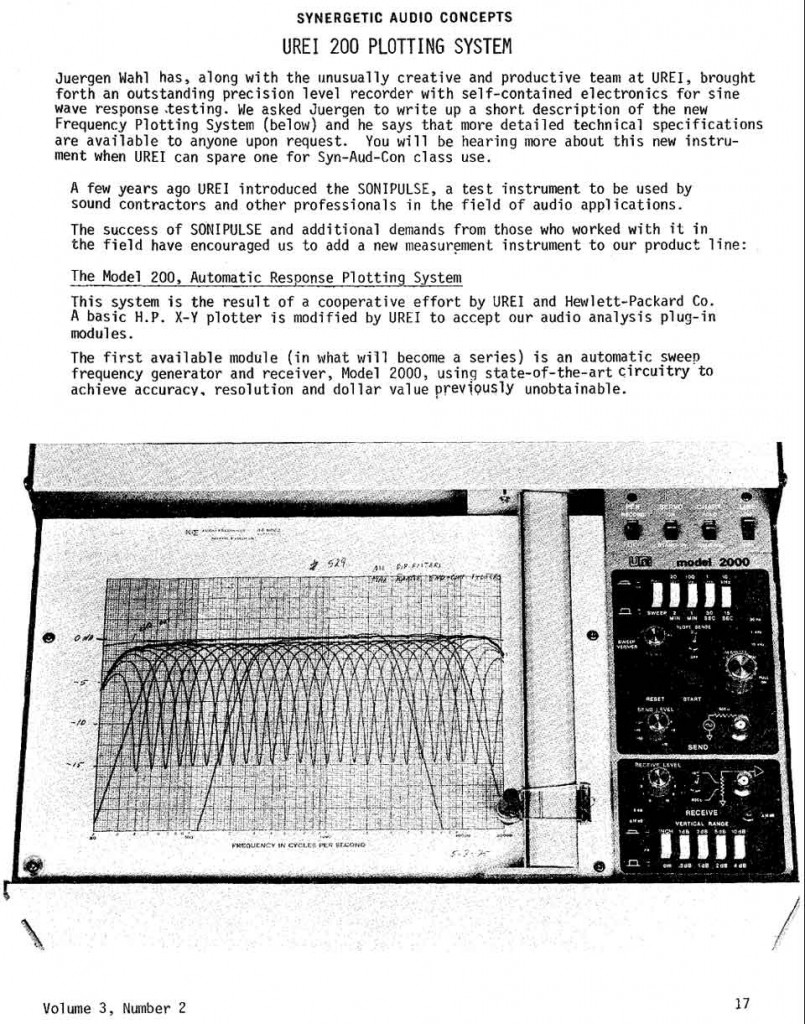
UREI 200 PLOTTING SYSTEM
UREI 200 Plotting System, continued
The 200 system with 2000 plug-in module produces hard copy frequency response plots wlth 0.05 dB resolution and more than 60 dB dynamic range. Standard 3 cycle semi- ( log paper, K&E audio paper, and DIN-standard paper are easily accommodated. Vertical scaling can be changed from centimeters to inches by a front panel selector switch.
Light emitting diodes indicate scaling units and system mode. Frequency may be manually adjusted with the plotter engaged to allow quick “dry runs” before cOrlmitting to paper.
An important feature of the Model 2000 plug-in is automatic Rate Sensing* and control, Which lnsures accurate tracing of steep amplitude excursions commonly encountered when measuring room acoustics with sine waves. This circuitry automatically slows the sweep rate when rapid amplitude changes are encountered, resuming normal sweep rate following such excursions. In this way, unsuspected sharp dips or peaks in response are never missed or minimized. *(Patent Pending).
The possible applications for this system are numerous: Room acoustics analysis, sine wave loudspeaker and microphone response tests, permanent records of EQ settings, equalizer and filter measurements, studio maintenance records, in short, frequency vs. amplitude plotting of any audio device or system. This self contained instrument fulfills our extreme requirements of reliability, dependability, accuracy and vel~satil ity. Incl uded are features which check the cal ibration of sensitivity as well as frequency. The modular design philosophy extends the future use of the Model 200 main frame to measurements of other audio acoustical and electrical parameters.
The suggested retail price of the 200 system including the 2000 module is well within the reach of any manufacturer, contractor, laboratory or studio, at a modest $2250.00.
MASH NOTE
From Rick Garner, Moline, Ill. (1975 Boston class)
One thing you might find interesting is that on my trip home from Boston, I shared a bus seat with Peggy Fletcher, granddaughter of Harvey Fletcher! It was quite a coincidence. I showed her her grandfather’s name in my text book and Lab Manual. She was amazed to say the least.
Many people make personal sacrifices to get to a Syn-Aud-Con class, especially young people. Rick traveled all nite from Sioux Falls, S.D. where he provided the sound for a rock concert, to get to the Boston class. When sacrifices are made it particularly pleasures me to receive Rick’s letter: “I appreciate being a Syn-Aud-Con graduate. I feel it is probably the most rewarding experience I’ve had to date.”
Three-time graduate Harvey Mills, Pro Audio!At~anta, is the first to attend the class in a wheel chair. Seems he hurt his leg and had to get around on crutches. Slipped on a wet floor and broke his other leg. Syd Stegall, President of Pro Audio/Atlanta and 3-time graduate and Office Manager, Pat Brandon. were in class to push his chair about — though Harvey doesn’t need a lot of push.
SYN-AUD-CON TRAINING SPEC
More and more specifications are being written that require evidence by bidders of special training in sound system design. Ken O’Toole sent in the following spec:
7. All bidders shall show evidence that they have in their employ, personnel who have attended sound engineering courses equal to Altec Acousta-Voice seminars or Syn-Aud-Con seminars.
And Dave Klepper of KMK Associates, New York, says he has a similar clause in his specifications.
SPEAKER SYSTEM MOUNTED IN CROSS
Ken Patterson, Soundplex, Kansas City class 1973 and 1975, gave us an architectural drawing of a speaker system mounted in the cross of a small church in the Kansas City area (reproduced here in part).
When the architect told Ken, I won’t have that ugly thing in my church,” Ken proposed a clever answer that the architect admired enough to re-design the cross to accept the speaker system.
SPIRAL MEMBRANE LOUDSPEAKER ENCLOSURE
Our Washington, D.C. class had the unusual experience of witnessing a unique new “spiral membrane loudspeaker enclsoure ll demonstrated and discussed by its inventor, Julius A. Kaiser of Kensington, Md. Mr. Kaiser’s paper was published in the August 1975 edition of the JASA. When we read the paper, we wrote Mr. Kaiser asking him if he would demonstrate the speaker enclosure to our DC class.
The spiral membrane loudspeaker enclosure has one startling feature that fulfills a requirement called for in a paper I gave at the 51st AES convention in LA: Higher Q off-axis than is available on-axis. This means that the long needed ideal parameter overhead distribution loudspeaker may now be possible. Such a loudspeaker would allow extremely smooth coverage over a far wider angle than conventional units. By providing higher Q off-axis (where the D2 distance is greater than the on-axis D2 distance) it is possible to maintain high intelligibility over wide areas below an overhead mounted loudspeaker.
The handmade prototype (made of poster board, a CTS speaker~ and a thin plastic membrane) performed according to theory and at low frequencies (the spiral does not operate at high frequencies in a Q controlling sense in this prototype) it demonstrated remarkable off-axis clarity compared to that expected from any conventional loudspeaker.
We asked Mr. Kaiser for background information which would give us some feeling about what led to the development of the loudspeaker enclosure. Mr. Kaiser wrote:
As for my background, I have been working in various Government labs in the Washington, D.C. area for the past 27 years; 10 years at the Naval Research Lab., 4 years at the Harry Diamond Labs (Army) and the most recent 13 years at the Goddard Space Flight Center. My specialty for more than 20 of those years has been in microwave antennas, holding 11 patents relating to the electromagnetic spiral. Also, in May 1960 I published a paper in the IRE PGAP on the electromagnetic spiral. It contains many of the same thoughts, and words, that appeared more recently in JASA. Having developed the principles of the electromagnetic spiral, it was an easy step to the acoustical spiral. This is not to suggest that my attempts to make an acoustical antenna met with immediate success – my attic has several models that could never :lave worked. In retrospect, however, the problems with acoustical radiators are in many ways similar to those of electromagnetic radiators, and as things turn out, the acoustical spiral has almost identical properties to those of the electromagnetic spiral, e.g., broad bandwidth, broad and constant beam width, constant input impedance, and polarized sound waves. The one important identity that led me to the acoustical spiral, however, is the anti-phase condition existing at the input which needs to be made in-phase before efficient radiation can occur.
Syn-Aud-Con will continue to watch with great interest the continued development of this unique device and its innovative developer.
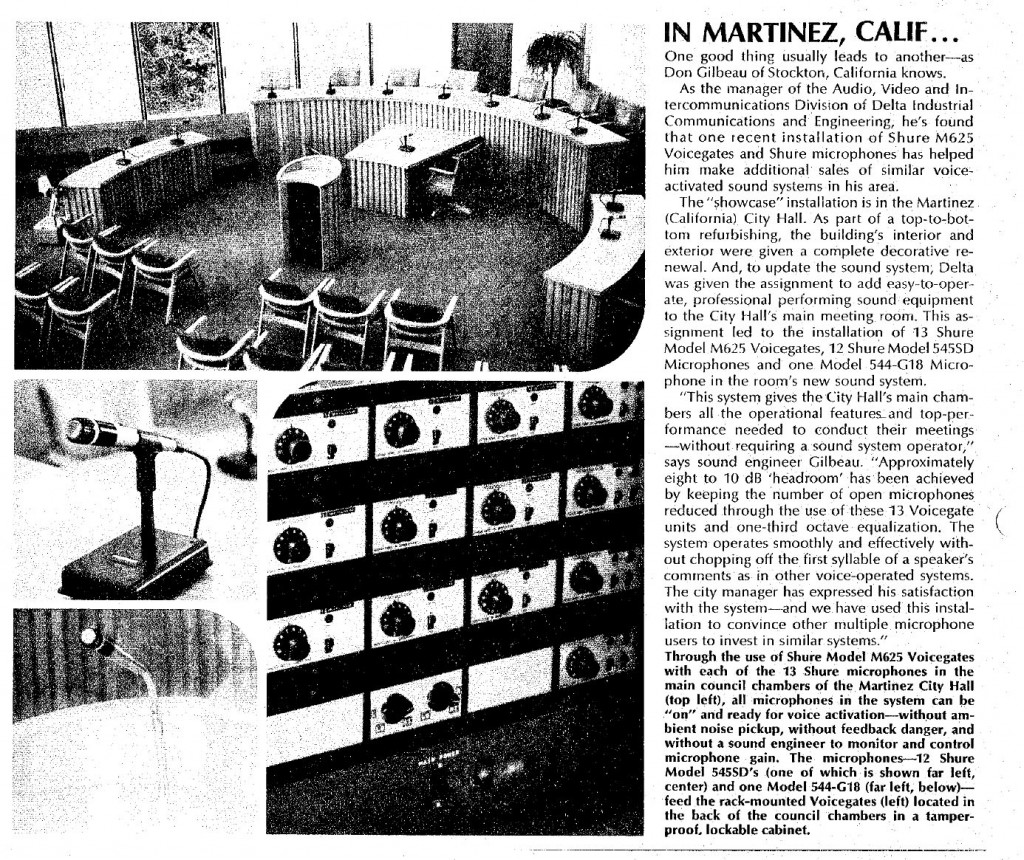
SHURE VOICEGATES ANSWER THE (ROLL) CALL. . .
Reprinted from SOUND SCOPE, December 1975 with permission from Shure Brothers.
Don Gilbeau is a graduate of the San Francisco 1973 class.
EULER’S THEOREM – ADDITIONS AND CORRECTIONS
SOUND QUOTES
From Concert News: liThe Who has also taken special interest in making sure that the audiences can enjoy the full spectrum of the performance. Arrangements have been made with Showco, to custom design the sound and lighting systems for the tour. The total sound system’s power will be hung from the ceiling to avoid any viewing obstacles. II
From Time Magazine, ” ‘Walk”ing,’ a costly piece of featherbedding pushed through by the union more than 20 years ago, requires the number of musicians to be scaled to a theater’s seating capacity. Thus, in a house with more than 1,300 seats, a musical scored for only five musicians must still have a full orchestra of 25 plus a conductor. The extra 20 simply walk away with a check. Local 802 Leader Max Arons explains with Carrollian logic: ‘We have to protect the public from being cheated. A couple of instruments can make a lot of noise today, but the public is paying for an orchestra and they shaul d get it.”
From Concert News: “There were illusive moments when the music seemed to surface, but the group’s (Uriah Heep) talent was consistently drowned out. It seems that when Heep has discovered a new plateau for their music, they should concei~e a stage presence to match the quality of their music. Beautiful instrumentals and meaningful lyrics can hardly be enjoyed or even shared when a group is bent on destroying what they have created through over amplification. It seems that they are lost in the same ole fantasy.”
“NO COMMENT” QUOTES
From a B.E.S. ad: “Engineers are trying to figure out how 3600 horizontal and vertical dispersion can be produced by a non-enclosure, non-baffled speaker.”
From Modern Recording, Test Results by “Our measurements of frequency response of this speaker system (and of all speaker systems to be tested in future issues of Modern R2cording) are made by applying third-octave bands of ‘pink noise’ at 24 spot frequencies, and recording the output of a precision-calibrated AKG condenser microphone positioned at a distance 1 meter from the system~’ (Ttalics mine)
From Westlake Audio Guarantee: II Power: 116 dB SPL minimum, linear scale, with broadband point noise source from one monitor measured at the mixer’s ear. The control room potential with four monitors is a minimum of 128 dB SPL (italics mine)

