Measured vs. Predicted Loudspeaker Array Response
Many designers use arrayed loudspeakers to cover the audience. Computer modeling must be used to determine the array behavior. This study compares the measured vs. predicted response of a 3-horn array.
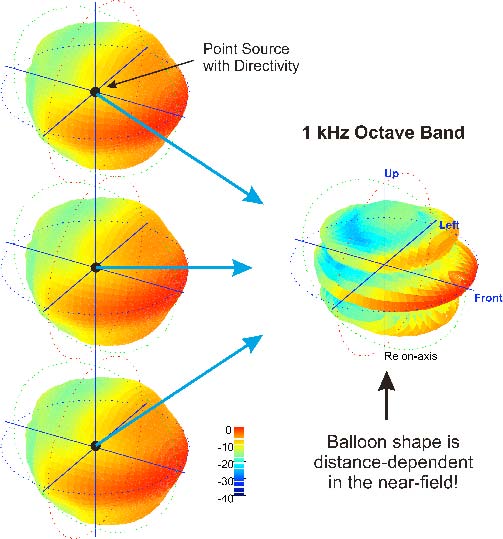
Room modeling programs predict array behavior by calculating the interaction of “point source” devices placed in 3D space. The array element “point source” is first measured at some appropriate angular resolution to create a building block for the array. The objective is to determine the array response through prediction rather than having to build and measure the actual array. Since the coverage of an array is distance-dependent, even if built it would have to be re-measured for every unique listener distance in its near-field. For large arrays this can include most or all of the audience – an impossible task. Also, if the array configuration is changed all measurements would have to be repeated. It is interesting to compare measured vs. predicted at a reference distance on occasion to test the validity of the concept. What follows is such a comparison.
The “point source” devices in this study are public address horns, and are band-limited to the human speech range (175- 5600 Hz, or the 250 Hz – 4 kHz octave bands). Each horn measures 0.65m (~ 2 ft) across the mouth. These are considered point sources since their directivity pattern does not change with increasing distance, beyond the distance at which it was measured (8 m). So, the data was taken in the far-field of the device. Far-field data is requisite for any component used in array modeling. The orientation and relative spacing of the devices are shown in Figure 1.
.
.
.
Figure 2 shows the octave-centered balloons of both the measured and predicted responses. Such comparisons are rarely apples-to-apples due to differences between supported resolutions, scales, etc. But, this is close enough to test the concept. The angular and frequency resolution of the measured data is 5-degrees 1/3-octave, and the octave-centered balloons are shown. The array data was predicted at 2.5-degrees angular resolution, and the octave-centered balloons are shown. The array element was measured by collecting an impulse response at 5-degree intervals at 8 meters. One quadrant was measured (600+ IRs) and then mirrored to produce the complete balloon.
The IR has both real and imaginary information (both magnitude and phase). The IRs were distilled into magnitude-only balloons for the purpose of this study. The predicted response considers both magnitude and relative phase (arrival time differences due to position), so interference effects between the devices are included. The lobing in the response makes this apparent.
At frequencies where longer wavelengths make the devices acoustically transparent, the correlation between measured and predicted is very high. At shorter wavelengths and angles where the devices are firing through each other, the correlation is reduced. The differences between the measured and predicted responses include device-to-device tolerance issues, as well as diffraction and interference effects from the close proximity of the devices. There currently exists no practical way to model these variables on desktop computing platforms, and they will exist irregardless of the resolution and data format used.
The correlation between the measured and predicted polars give confidence that arrays of this type can be modeled with adequate accuracy for sound system design work. One can with confidence create various arrays of these devices in a virtual environment to determine the appropriate configuration for an application. pb


