"In Situ" Absorption Coefficients – Part 2
The best data comes from actual measurements. The absorption coefficients of a surface can be measured “in situ” with almost any measurement system. Here is a method and some caveats.
If you own a measurement platform, the absorption coefficient (ABS) of a surface can be measured “in situ.” This may be useful for modeling a room that has an extensively used material that you are unsure of, or when the data that you have for that material seems too uncertain to stake your reputation on.
A “one bounce” test can yield the approximate ABS coefficient of a surface by measuring the level reduction of the reflection. Several standards exist for performing the test, so there is no need to invent a new method here. What follows is based primarily on ISO 13472-1:2002, with some added embellishments to streamline the process.
Figure 1 shows a table for converting the level reduction of a reflection to the absorption coefficient. A link is provided to a small spreadsheet for executing the math in this article.
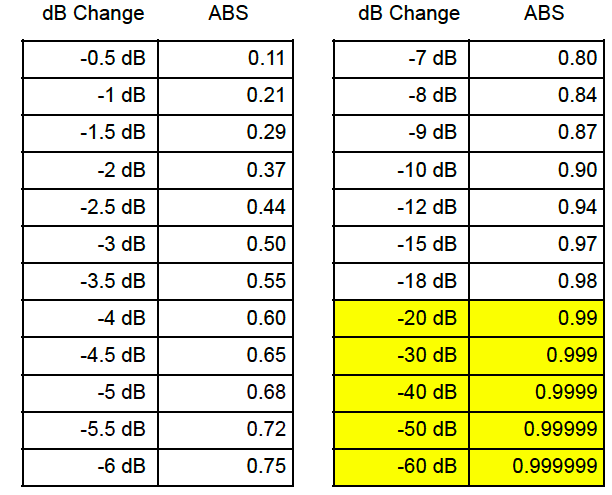
Figure 1 – The ABS of a material can be determined from the reduction in SPL of a reflection from that surface. Yellow represents Anechoic
Click here for a simple spreadsheet for calculating the table and the sample radius of the material-under-test.
The Method
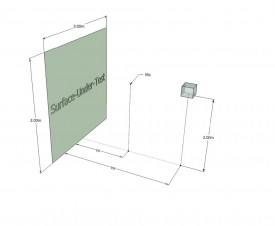
The method involves playing a test stimulus from loudspeaker aimed normal to the surface-under-test (Figure 2). The loudspeaker should have a flat frequency response magnitude for the 250Hz-4kHz octave bands. Most small cone drivers will suffice with some equalization.
The sample radius based on distance is given by the formula
where TW is the time window length and c is the speed of sound (340 m/s).
I used the NTI Talkbox™ as the source, as it is very flat from 100Hz – 10kHz via its on-board DSP filtering. Note that the impulse response is that of a linear phase filter (Figure 4). The price paid is very long latency (~60ms) which does not affect its usefulness for this application. The internal amplifier is sufficient to produce about 72 dBSPL at 1 meter. The battery-power option is convenient for quick setups (Figure 3).
For these tests I drove the Talkbox line input from the acoustic measurement system. The Talkbox stores WAV files for playback, so a reference sweep can be stored there and captured with a recorder to speed up site work, negating the need for a PC on site. This method of impulse response measurement has been well-documented in past Syn-Aud- Con articles.
Note that the stimulus must pass the microphone on its way to the surface, and that the measurement (or recording) will include this direct sound, the reflection, and additional reflections from the test environment. For further processing, the direct and reflected sound waves must be separated. This can be done with a conventional time window as implemented by any FFT-based measurement system. This requires adequate physical separation between the loudspeaker, microphone and surface-under-test to allow a time window of sufficient length to isolate the reflection and resolve its spectrum with the desired frequency resolution (Figure 4). Also, larger separations require a larger sample size, so one problem leads to another.
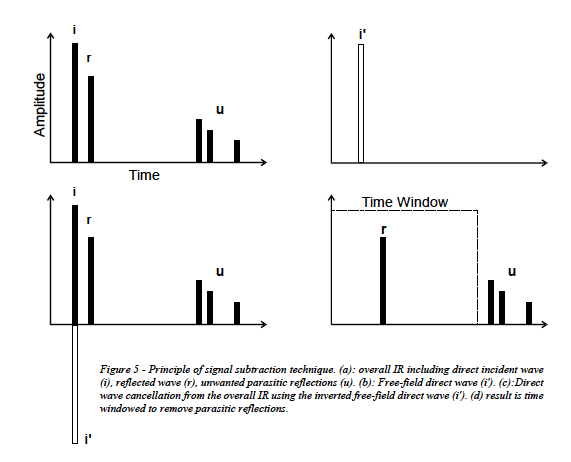
A novel work-around described in the previously reference paper is to cancel the direct sound wave by subtracting an exact replica from the resultant IR (Figure 5). The subtraction technique allows the microphone to be placed very close to the surface-under-test and to make a temporal window around the reflection limited only by the next-arriving (parasitic) reflection from the environment.
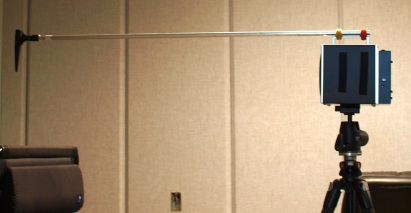
This proved trickier than I expected, as the complete cancellation requires an exact inverse of the direct wave. Even a one sample difference or slight phase shift will result in incomplete cancellation. I had first envisioned measuring the Talkbox once, creating an inverse, and then always using this inverse for future testing. I quickly found that there are very sensitive variables involved, and that the direct response must be measured under the exact same conditions as the surface-under-test. To facilitate this I built a simple test rig that allows exact spacing and orientation of the Talkbox and microphone (Figure 6). I can now make my reference measurement (used to cancel the direct field) in a free-field (away from room boundaries), and then pick up the whole rig and place it near the surface-under-test. Since the spacing, temperature and humidity are maintained, nearly complete cancellation of the direct field is possible.
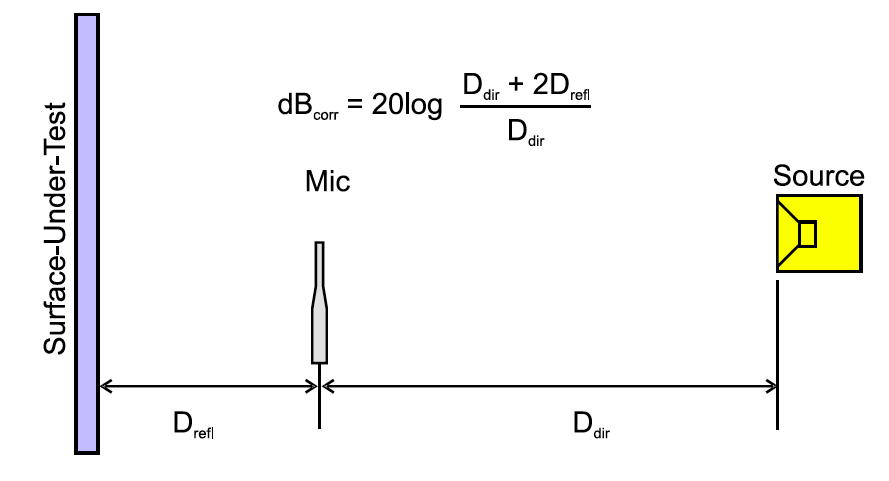
The reflected wave (the wave of interest) must be level corrected for the additional distance traveled beyond the direct wave (Figure 7). This distance is easily determined when testing a smooth surface, but more difficult when testing a surface that has some physical relief. The potential error is reduced by placing the test rig farther from the surface-under-test, but this requires a larger sample size and reduces the time offset between the wall bounce and the parasitic reflections. All of these points serve as a reminder that there’s no free lunch in audio, and that it is all about coming up with a workable set of compromises.
The Procedure
Let’s do a few to get a feel for the process. Pages 6 and 7 (bottom of the article) show the steps and plots for measuring ABS in situ. On page 6 I have annotated the required steps. Your steps may vary depending on your measurement platform’s features. I used Monkey Forest for this exercise, as it provides all of the required signal processing. Many WAV editors will allow you to invert the reference response and sum it with the direct + reflected response.
Note that the actual behavior of a surface is quite complex, and that we are representing it with a simple weighting factor. As can be seen from the chart in Figure 1, the ABS coefficients for surfaces with low absorption are very sensitive. A large, concrete room could have a predicted RT that doubles or halves with a very small change in ABS. This is one reason why experience, intuition, and even educated guessing are important parts of the modeling process. It also helps to have measured room data to aid in the refinement of the model.
It should be noted that a number of methods exist for measuring the ABS of a surface. They can and will produce different results depending on the specifics of the method used. Remember that the Sabine equation is based on ideal assumptions that rarely happen in typical auditoriums. From a system design point of view, it is always best to be conservative with ratings of any type. A conservative approach builds headroom into the design that can compensate for erroneous data or some parameter that you forgot to consider.
The method presented here allows a meaningful ABS estimate based on two measurements. These can be done in seconds with proper preparation regarding the test rig and instrumentation. Perhaps the greatest benefit is the understanding gained from looking at the complex nature of sound absorption, and the realization that our room models must grossly simplify what happens in nature. The most important piece of information about any tool is an understanding of its limitations. pb

