The Room Reverberation Time – RT
The reverberation time is a basic “one number” measure for characterizing a room’s acoustic behavior.
I’ve written much on the RT in the past. Richard Honeycutt’s article on reverberation formulas prompted me to revisit the topic and add some thoughts and insights that gradually form through the years.
Sound Persistence
The reverberation time (RT) is one of the most fundamental room measurements. It gives a broad brush stroke description of the general acoustical behavior of a space, paving the way for the use of other measures to determine sound clarity and speech intelligibility.
Wallace Clement Sabine was the first to formalize the RT into an acoustic measure. His method of measurement involved a program source, a stopwatch, and a quiet room (Fig. 1). Sabine determined that 60 dB of room decay was audible in a quiet space, so he formalized the RT60 (now T60) to describe it. Sabine’s work provided the statistical RT formulas that are still in use today.
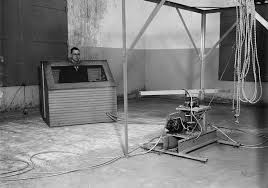
Figure 1 – Sabine developed his formula empirically by experiment.
The Sabine equation has two important attributes. It is statistical and empirical.
A statistical equation assumes a uniform condition throughout the room. The variables are volume, surface area, and surface alpha. There is no variable for listener location.
An empirical equation is based on observation or experiment rather than theory or logic. Sabine could measure the RT with reasonable accuracy, and he could calculate the room volume and surface area with high accuracy. This leaves the absorption as the unknown variable (Fig. 2). Sabine added a multiplier that made the calculated T60 fit the measured T60. There are two uncertainties – the multiplier and the average absorption coefficient (alpha).
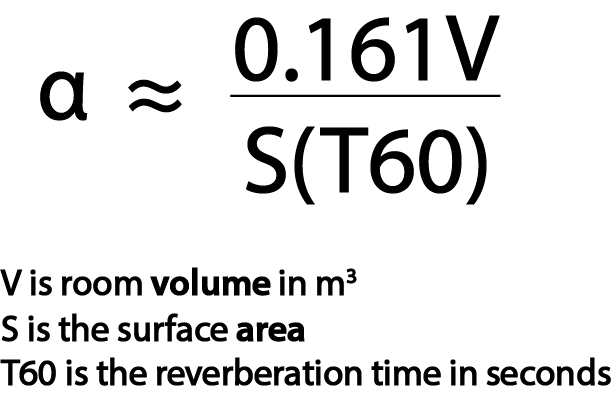
Figure 2 – Like Ohm’s law, the Sabine equation can be rearranged to solve for any of the variables if the others are known. Here it is solved for the average alpha of the room.
Sabine Equation Shortcomings
Acoustical equations have limited accuracy. Some red flags with the Sabine equation include:
1. It does not calculate the room volume with good accuracy. This is evidence of the uncertainty of the multiplier and alpha values.
2. It is conditional, in that the room must have low absorption (<0.1) that is uniformly distributed throughout the space. It must also have a “mixing” geometric shape, where similar numbers of reflections occur in the X, Y, and Z directions.
Richard Honeycutt’s article “Calculating RT” (included with this Member Update) describes some efforts to overcome the shortcomings of Sabine’s formula.
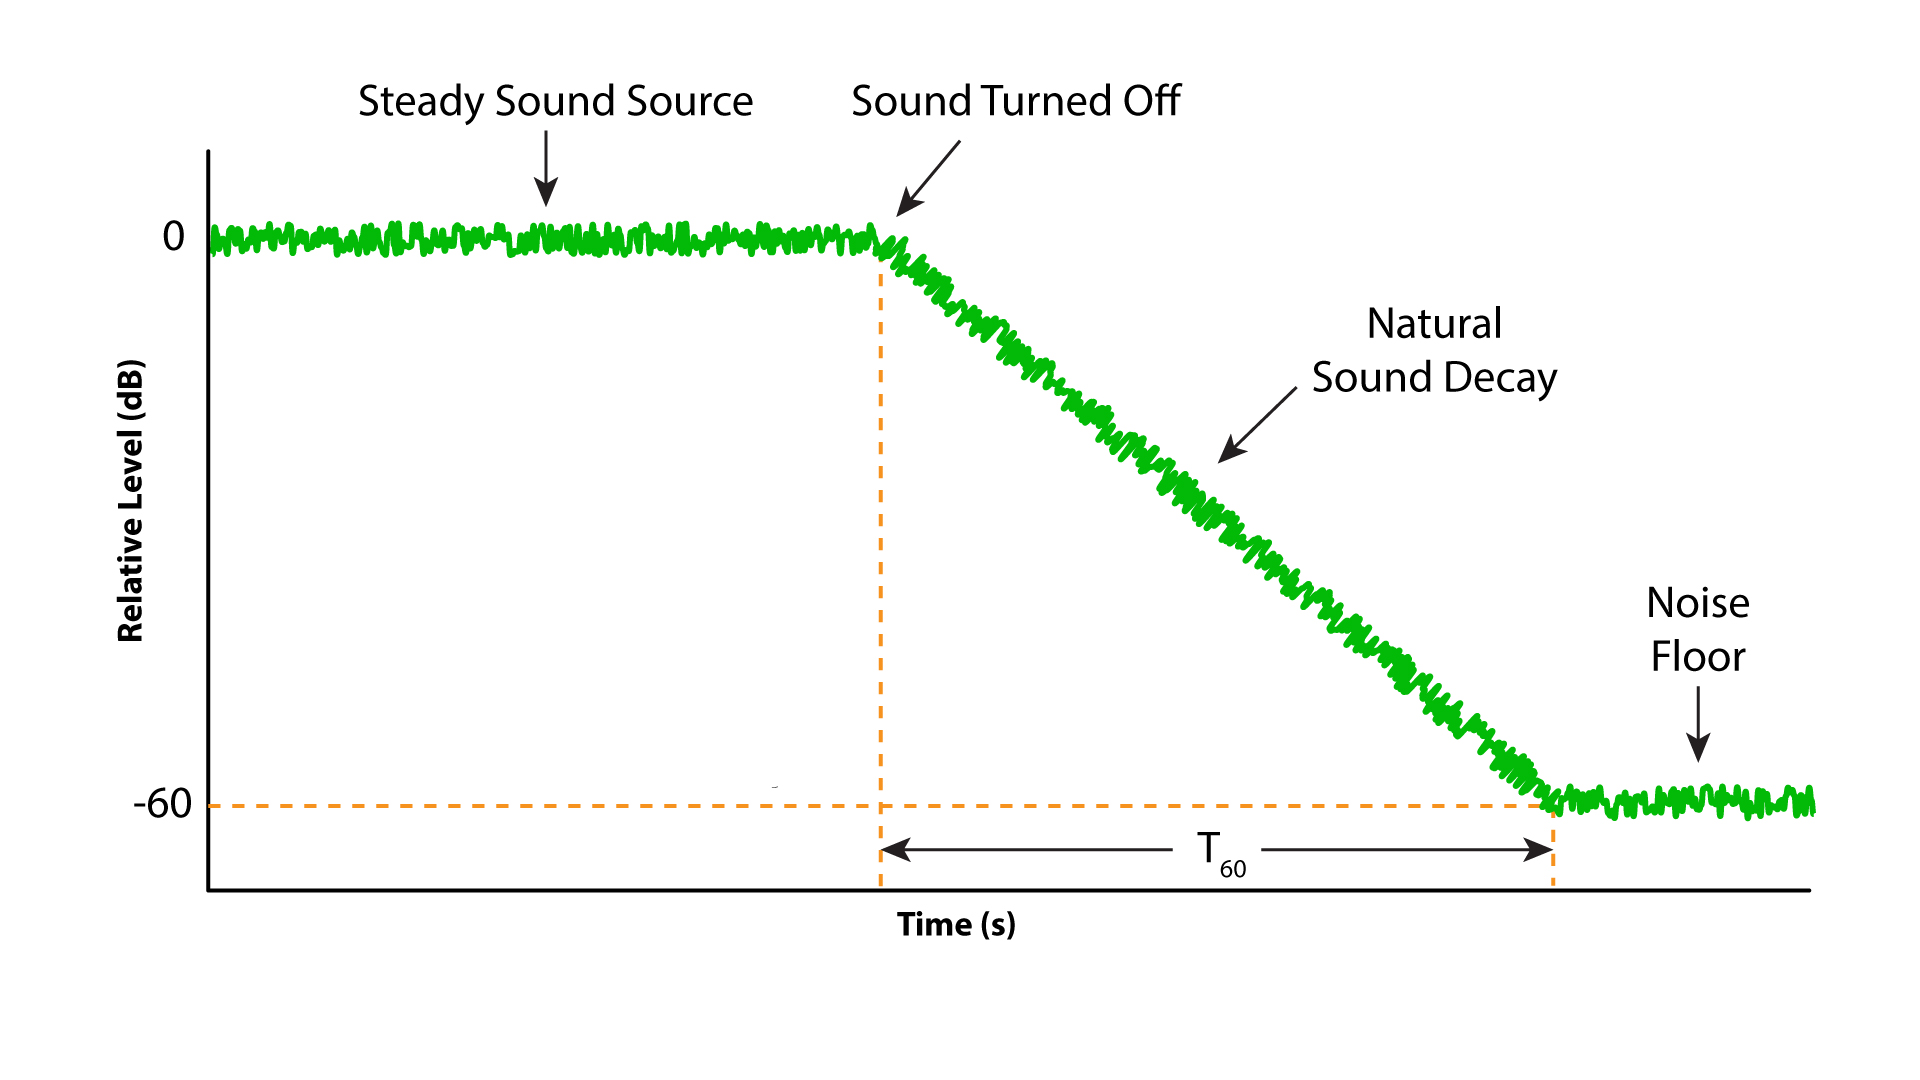 Figure 3 – Sabine’s method of RT measurement was timing the decay of an interrupted sound source.
Practical RT Measurements
Sabine established a very quiet room for his RT measurements. This allowed him to time the room for 60 dB of decay. Modern rooms are not typically this quiet. A solution is to measure 30 dB of decay and extrapolate to 60 dB of decay. This is usually valid because once the sound energy has reflected enough times to become diffuse the decay rate usually remains constant until the sound has fully dissipated. There are exceptions. While T60 can be estimated by listening, T30 measurements require instrumentation.
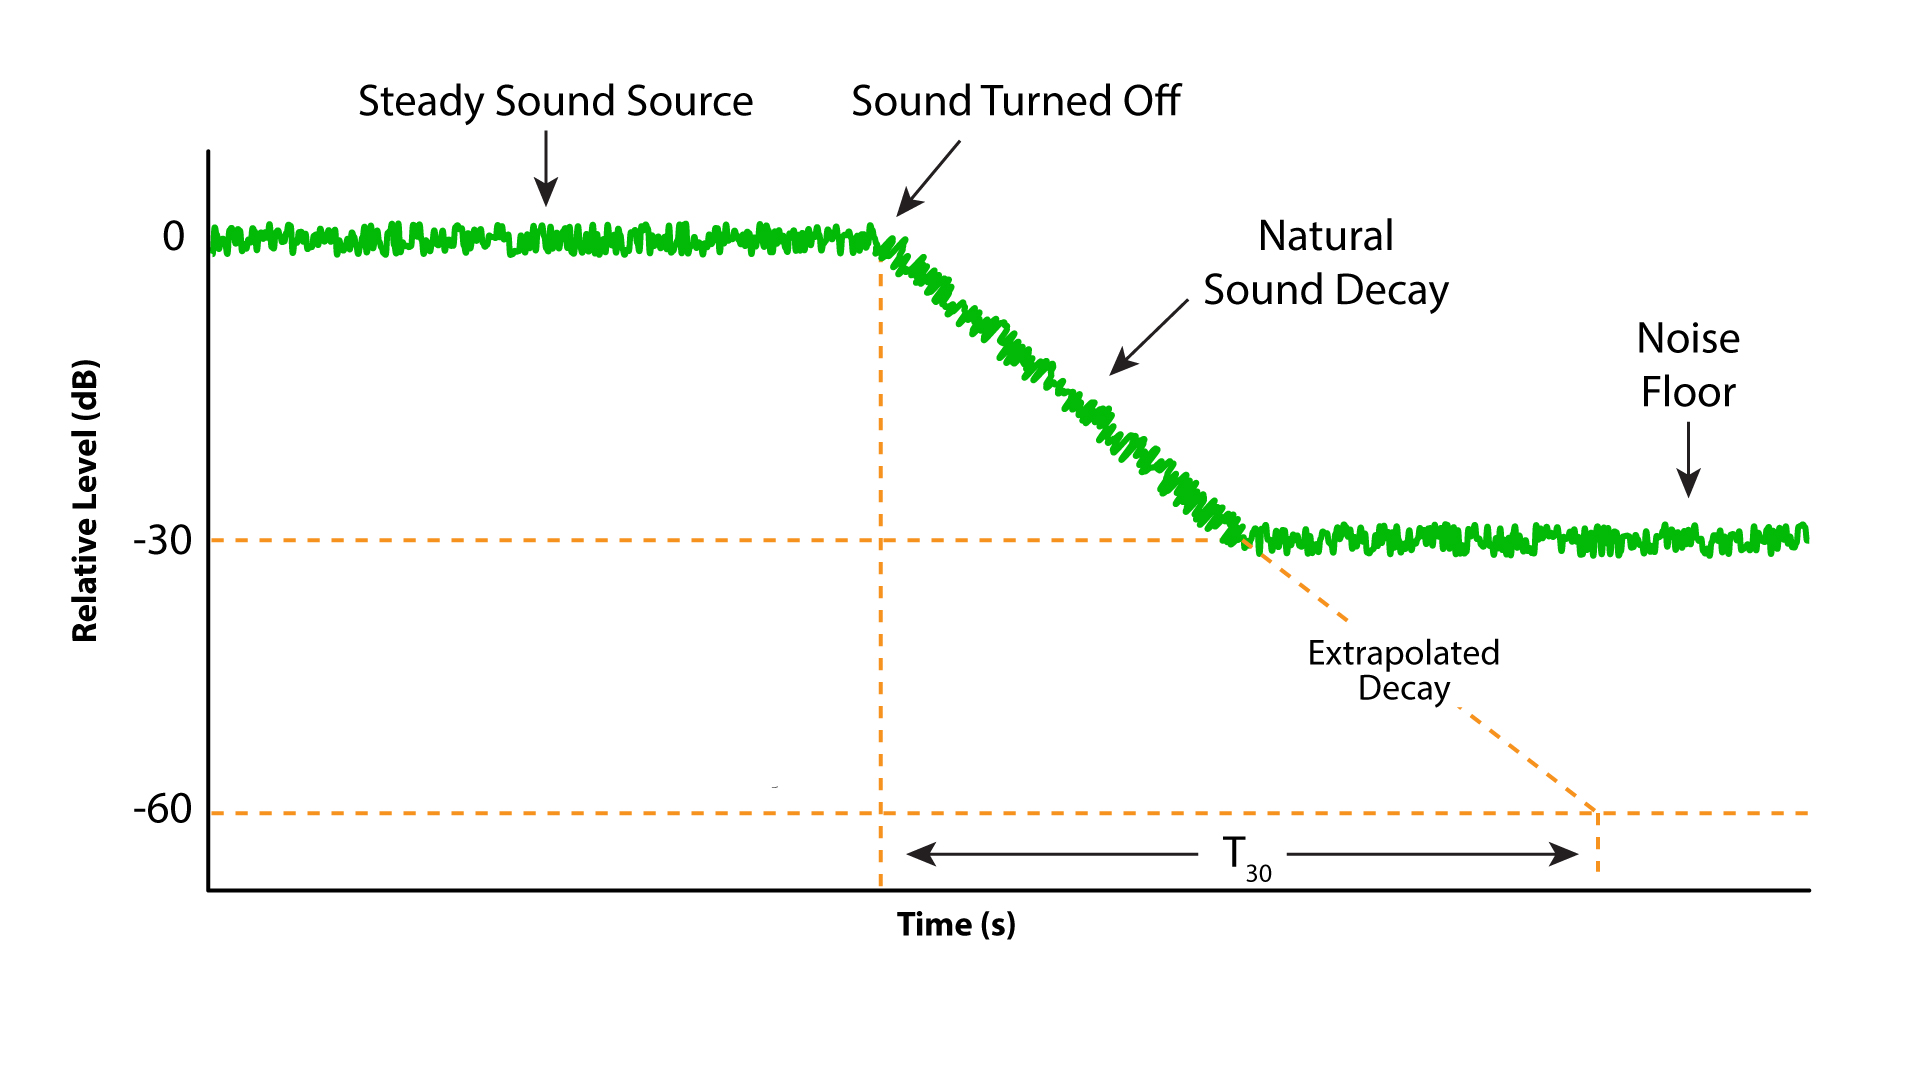 Figure 4 – The T60 can be extrapolated from 30 dB of decay if the decay rate is constant. T30 equals T60 in practical cases.
Surface Alpha
The absorption coefficient α attempts to quantify a complex behavior with a single number. A room modeling program treats this as the percentage of sound absorbed by a surface. An acoustics lab determines the α of a material by comparing the measured RT of a reverberation chamber with and without a sample of the material. This method allows α values greater than 1 (100% absorption).
The answer to “How much sound does a surface absorb?” does not have a simple answer. The reasons include:
1. Alpha is frequency-dependent.
2. Alpha depends on the angle-of-incidence.
3. Alpha depends on the sample size.
4. Alpha depends on the measurement methodology.
5. Like rooms, α is influenced by both geometric and wave-like sound behaviors.
The result is that α is always an approximation. No two acoustics labs will get the exact same α when measuring the same material. Most published absorption coefficients are for random incidence sound.
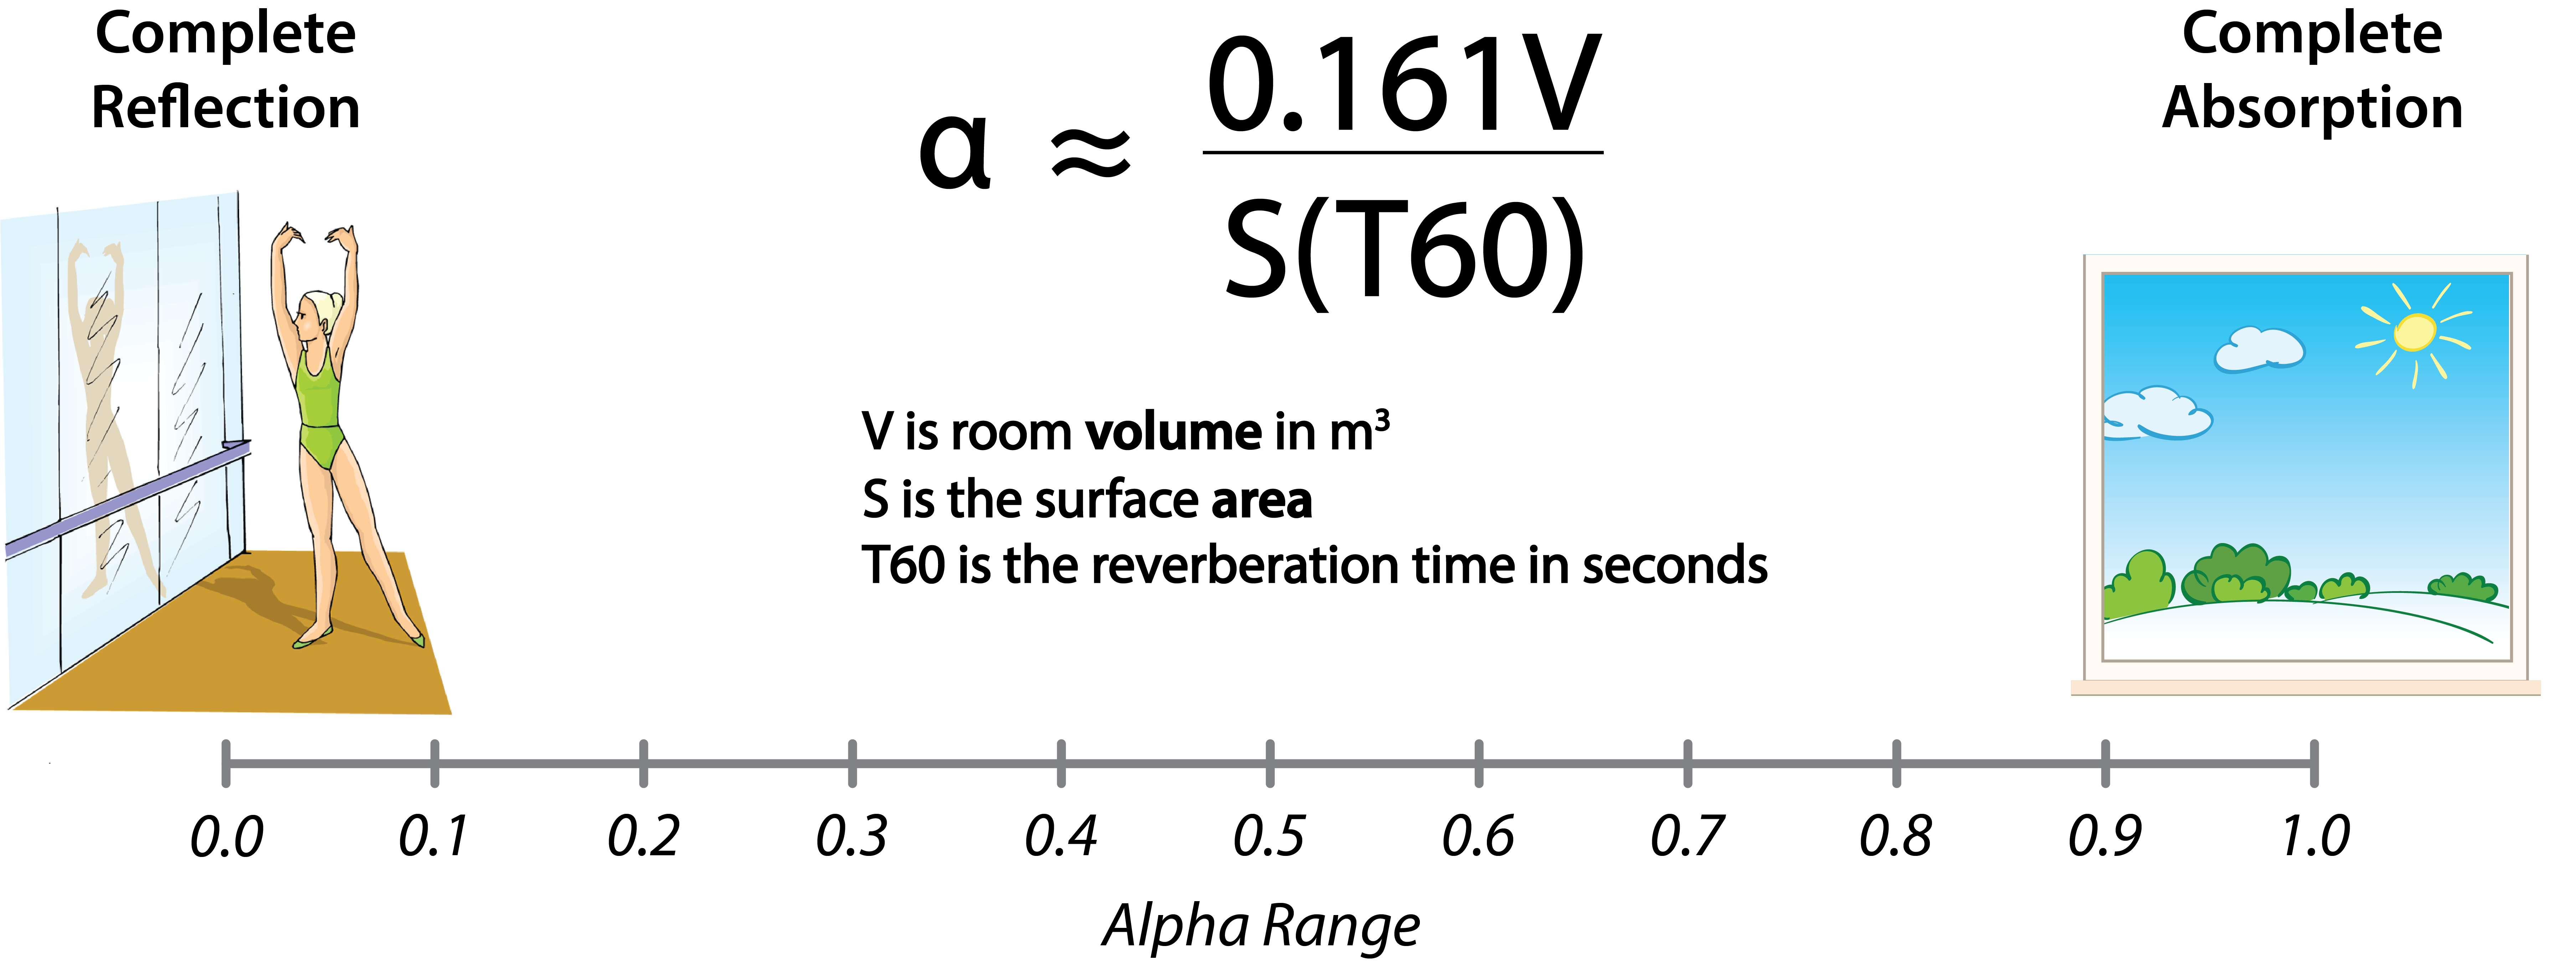
Figure 5 – In a room modeling program, α is a percentage. The possible values are bounded by complete reflection (0.0) and an open window (1.0).
The Room Impulse Response – RIR
Further refinements in determining T60 came with the ability to measure the Room Impulse Response (RIR). ISO3382 is an international Standard for “scoring” the RIR. First, the squared RIR is backward integrated (energy summed from right-to-left, a.k.a. the Schroeder curve) (Fig. 6). The slope of the Schroeder curve is used to determine various decay times.
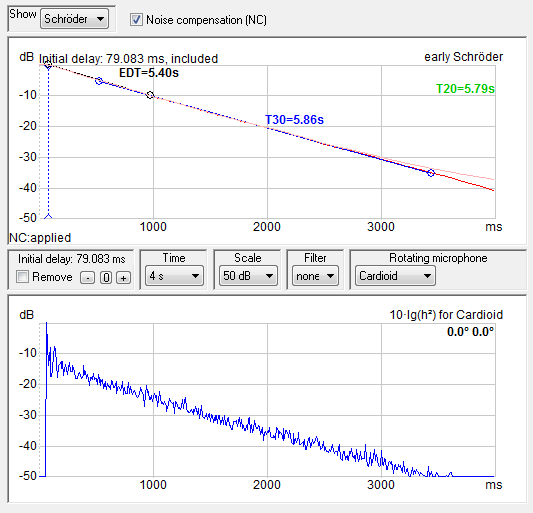
Figure 6 – T30 can be determined from the room impulse response (RIR) from the slope of the reverse-integrated room decay. This “Schroeder backward integration” (top plot) is performed by acoustics measurement software.
There is an important distinction between collecting the T60 using balloon pops or noise bursts to collecting it with a transfer function measurement. A recording of a balloon pop includes the spectrum of the burst – usually a “hay stack” when viewed on a level vs. frequency plot (Figure 7). As such, different balloon types can produce different results. The decay time may be the same, but the spectral content may be different.
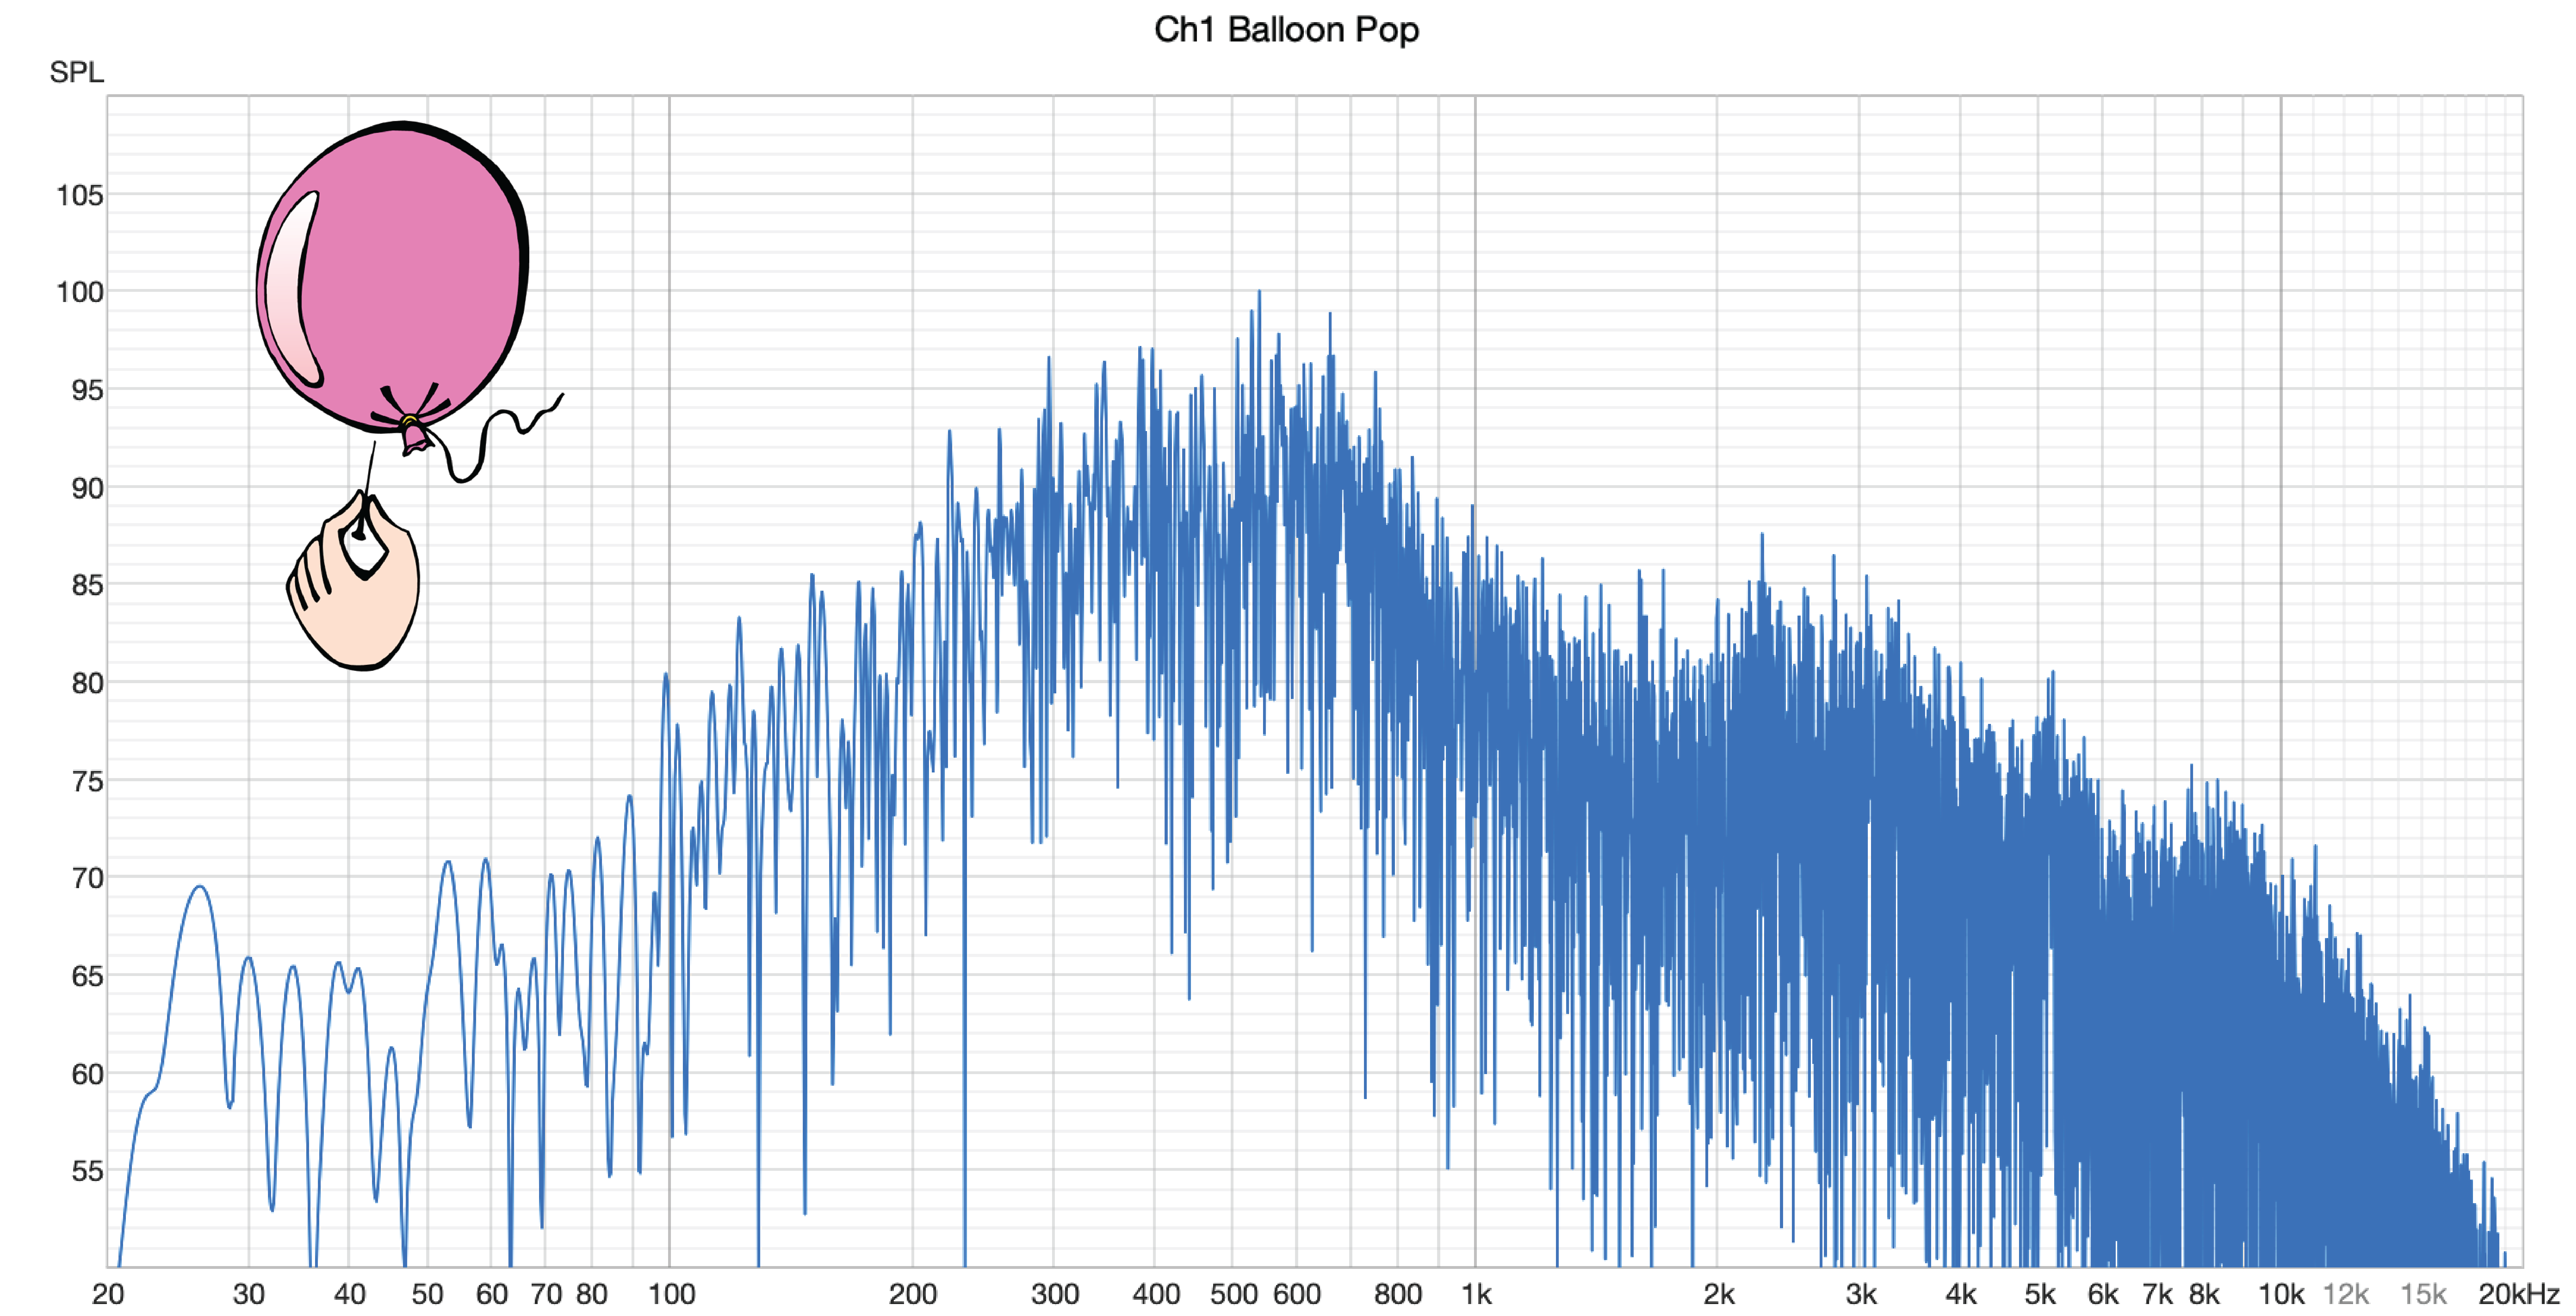
Figure 7 – The spectrum of a balloon pop is a haystack. It is not suitable for listening via convolution (Room EQ Wizard).
PC-based measurement systems measure the transfer function of the room. They emit and collect a known stimulus, usually a logarithmic sine sweep. These two signals are divided to reveal the transfer function (TF) of the system. The spectrum of the stimulus is removed by the division process, leaving “what happened” to the signal when it passed through the system. The TF is processed to reveal the RIR.
The RIR has a white spectrum (equal energy-per-frequency). Convolving it with speech or music (both have a spectrum) reveals what the room sounds like when excited by the loudspeaker used to measure the RIR.
In the same way, a mixer or equalizer has a frequency response that it imparts to the spectrum of the signal that passes through it.
Time and Frequency
While T60 is a useful measure, it is only one of many variables that determine the sound of a loudspeaker and room. In many rooms the tonal character of a system is determined more by discrete reflections than the diffuse energy. Ten rooms of various shapes and sizes with the same T60 will sound completely different due to the specular reflections arriving at the listener. As with measurements, both the time and frequency domains are required to characterize what is heard. T60 is of course a time domain measure, but the time domain is frequency blind. It reveals “how long” but nothing else.
What is T60 Used For?
I use the T60 and its variants (e.g. T30) to guide in the production of room models for acoustic simulations. Figure 8 shows the predicted and measured T30 for a recent project. Once the room wireframe is drawn, T30 data can be used to aid in the selection of surface alphas.
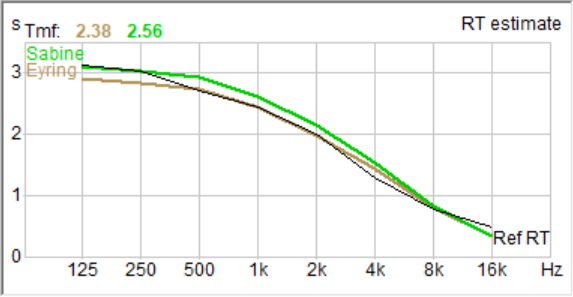
Figure 8 – Overlay of the T60 of a large auditorium. The measured T30 (black trace) is plotted along with the Sabine (green) and Eyring (brown) predicted T60 (CATT-Acoustic).
The process is logical:
1. Start with a reference alpha assigned to all room surfaces. It can be very high, or very low. Either way it should yield a T30 much higher (or lower) than the measured T30. Now we begin sculpting.
2. Select an alpha for each surface type, beginning with the largest total area and working toward the smallest.
3. One-octave resolution is appropriate for this task. I use “best guess” absorption coefficients from the materials in the modeling software database, and then refine them to sculpt the T60.
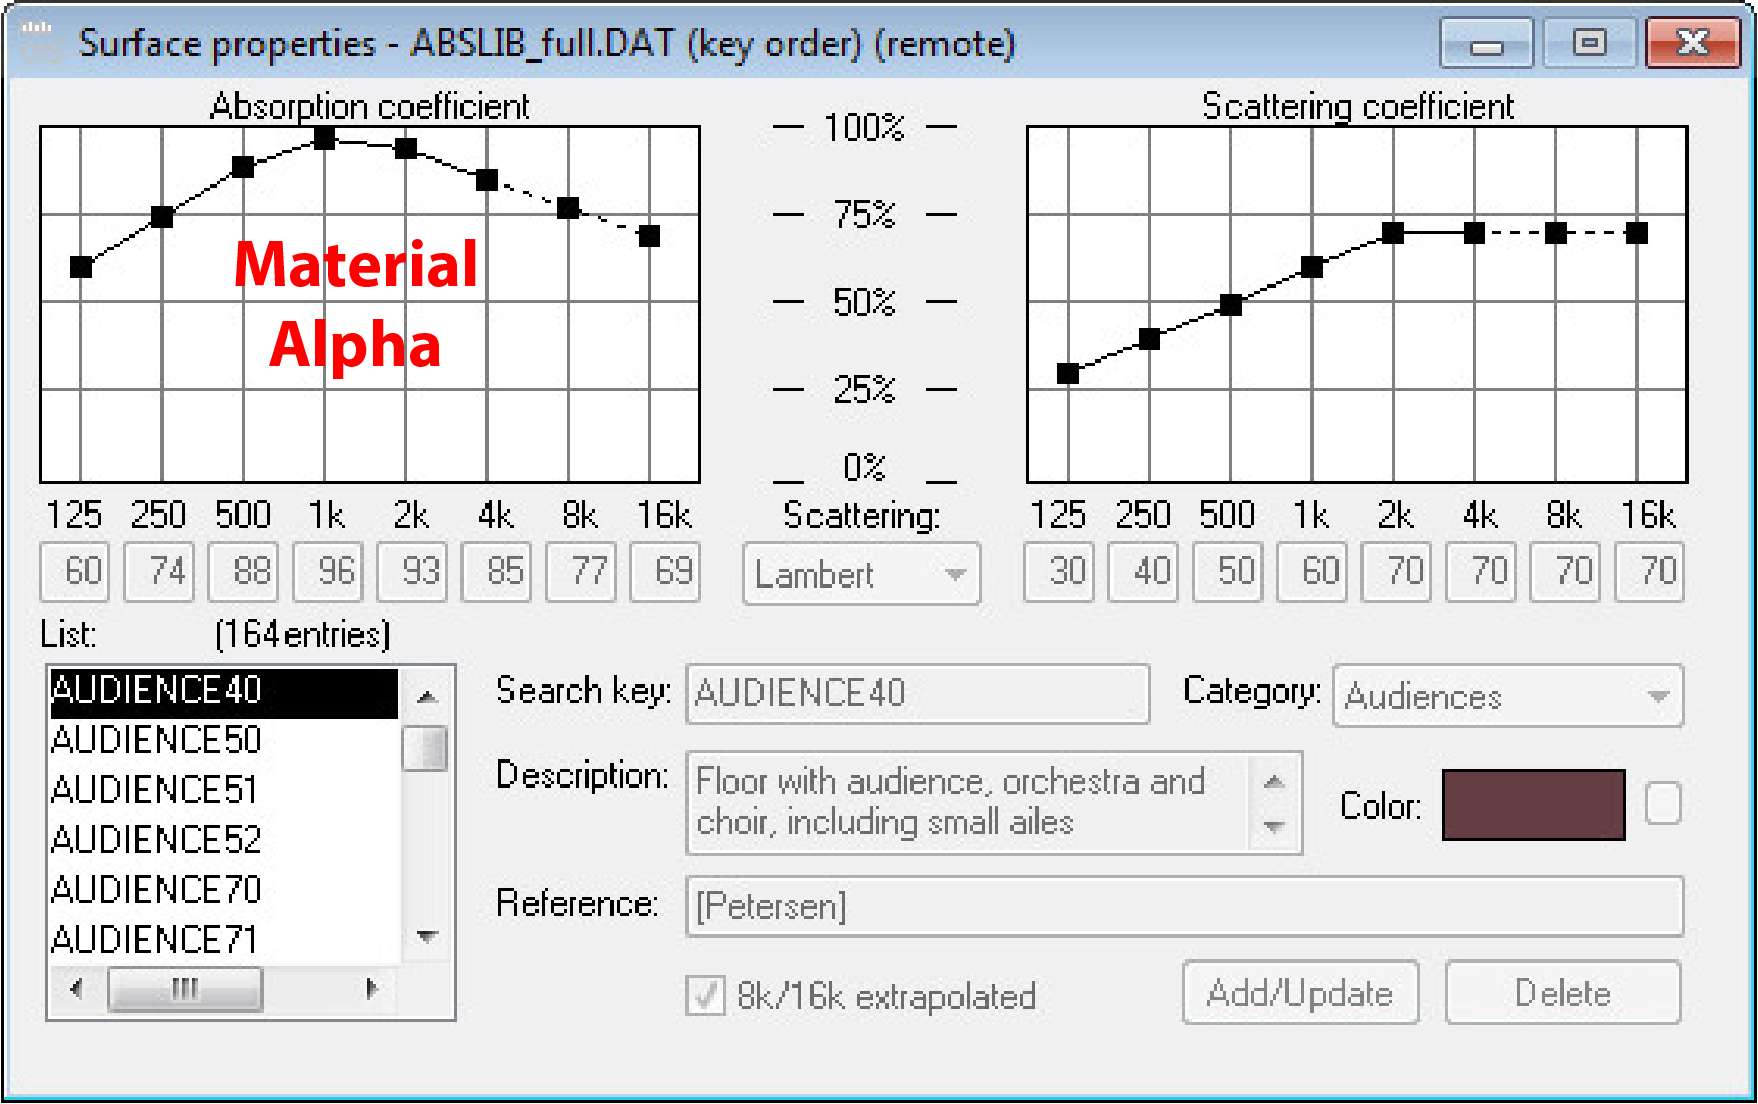
Figure 9 – An entry from a database of absorption coefficients (CATT-Acoustic).
4. If you collected RIRs in the actual space (always a good idea), generate an RIR for the equivalent positions in the model, using EASE or CLF data for the device used to make the room measurements.
5. Refine the alphas until T30, C50, and STI are in reasonable agreement.
You can now have confidence that your room model will be useful for trying your system designs.
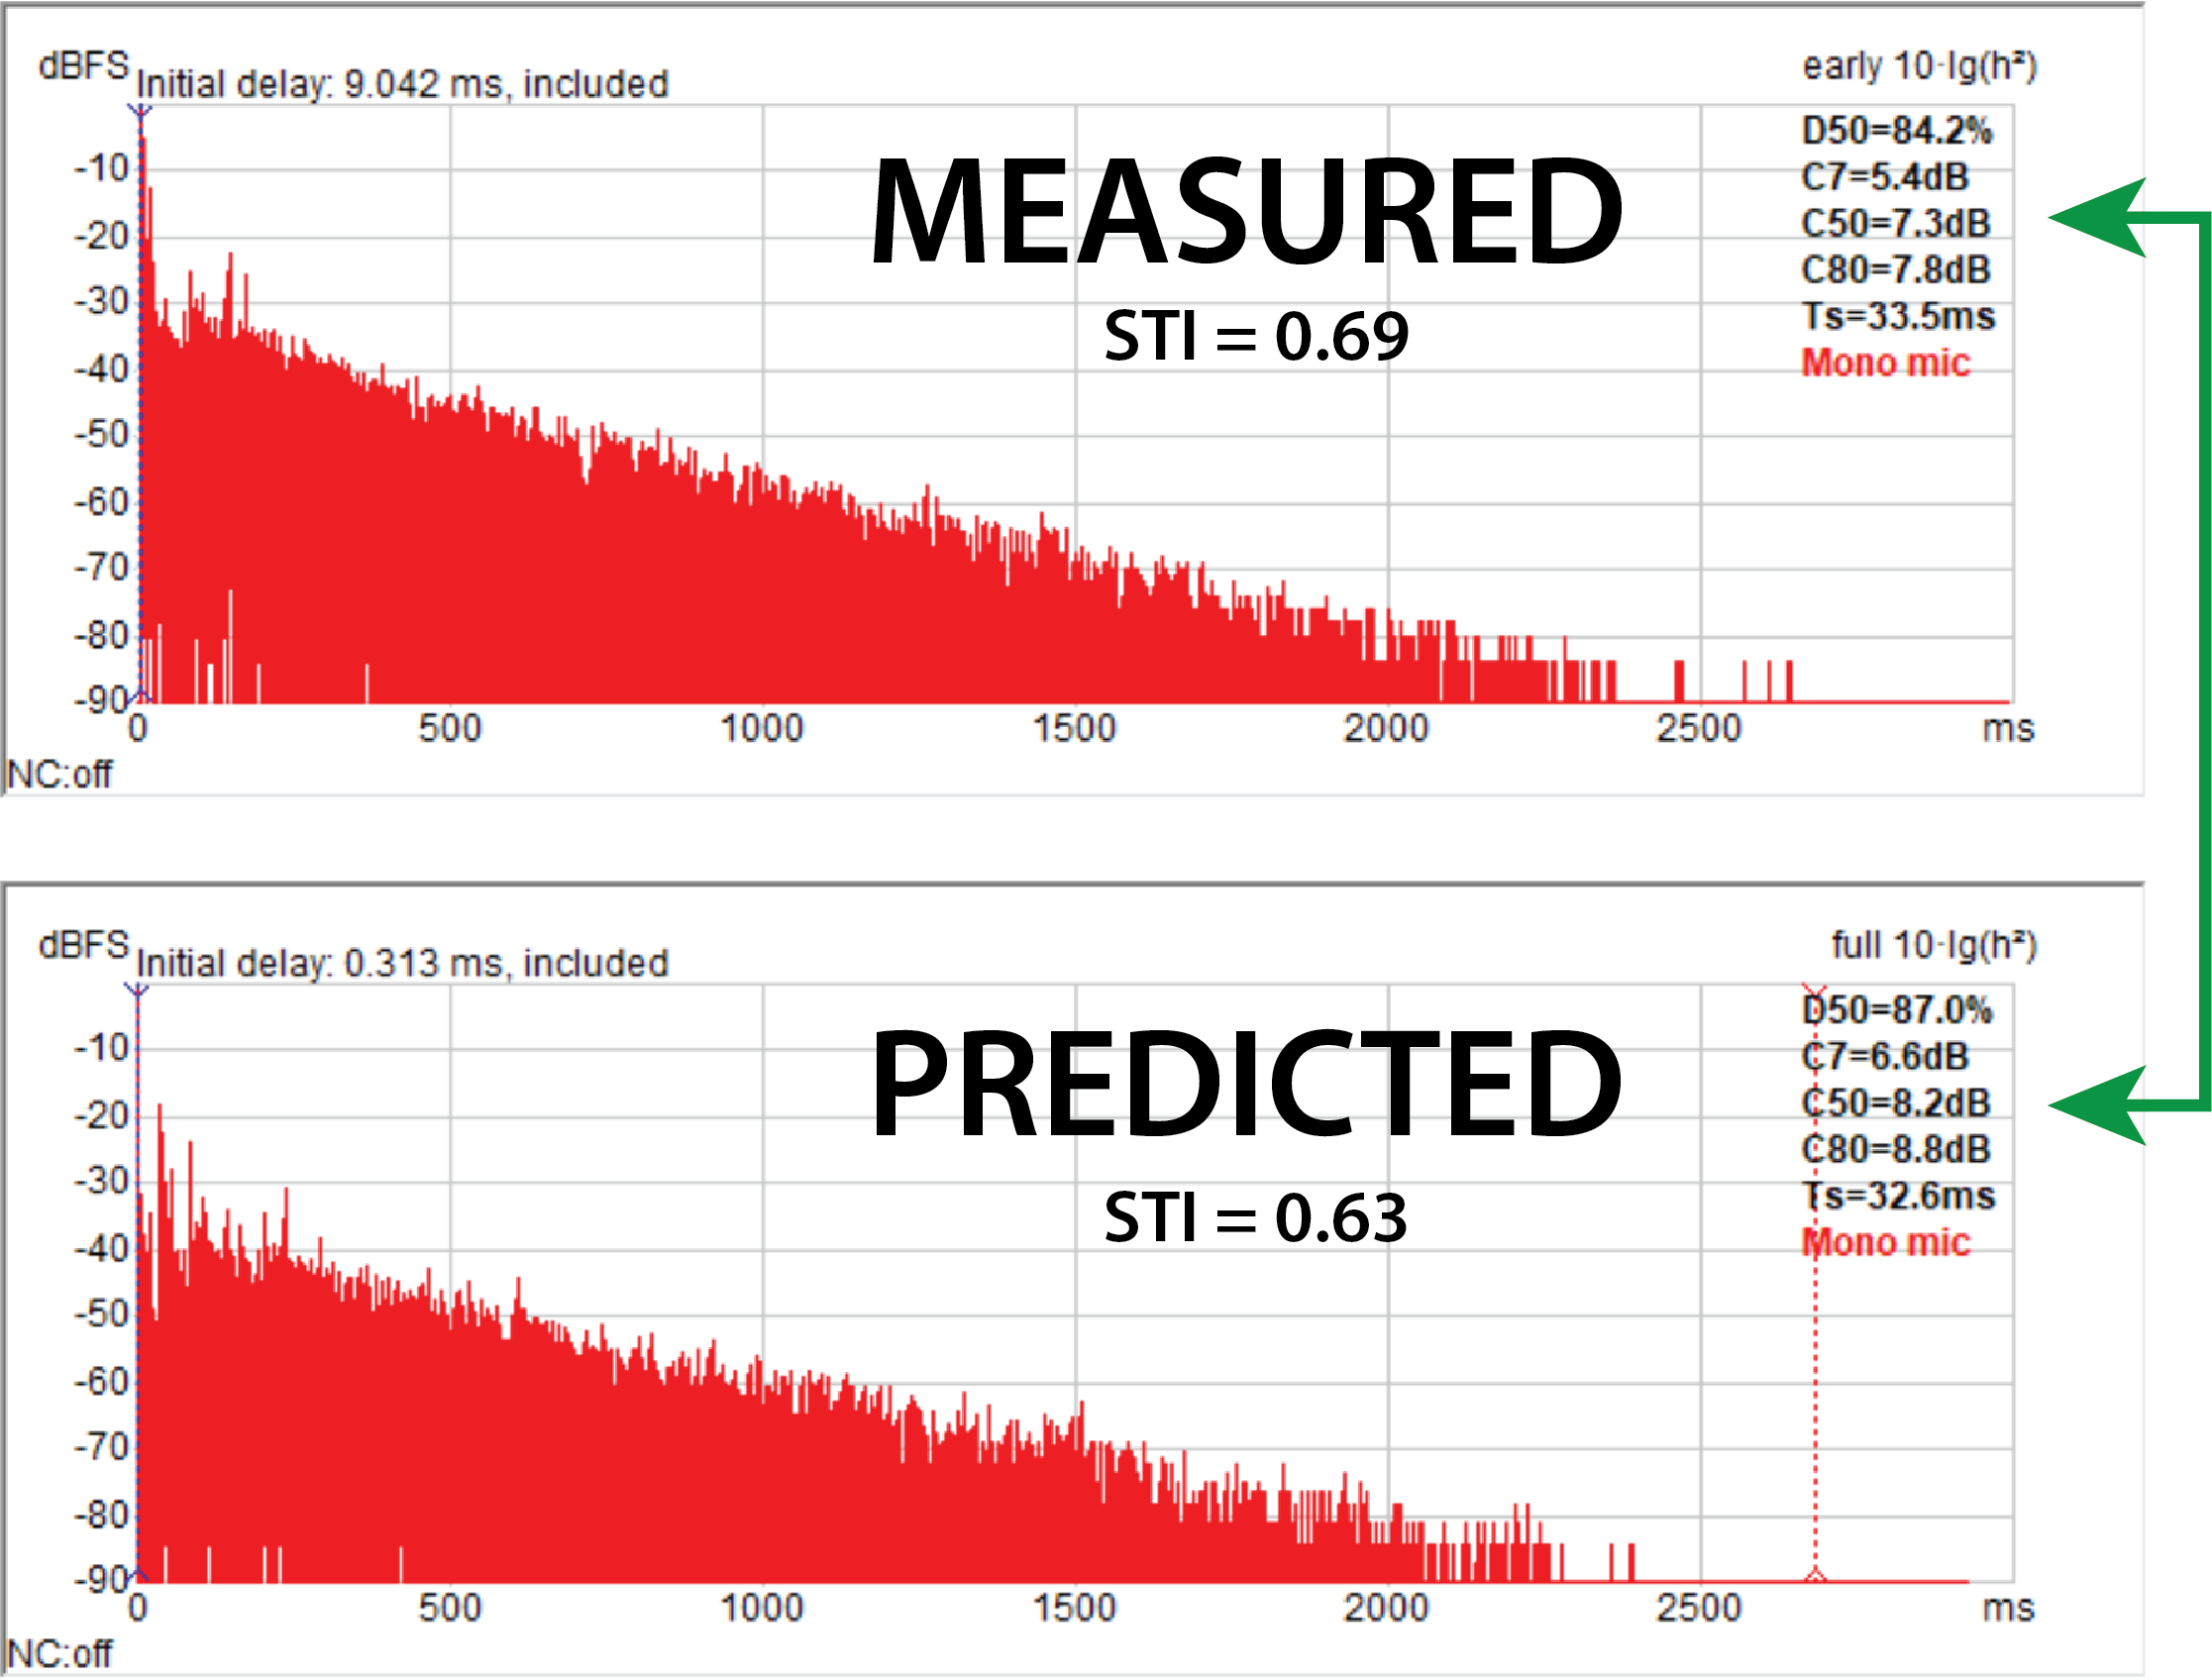
Figure 10 – Measured vs. predicted RIR for the same seat of a large, reverberant auditorium. The loudspeaker is placed on stage. A CLF file of the test loudspeaker was used in the modeling software. The T30, C50, and STI are in good agreement (CATT-Acoustic/ReflPhinder).
↑ Convolution of measured RIR.
↑ Auralization of predicted RIR.
Figure 11 – The measured and predicted results can be compared using convolution. Further refinements can be made by 1. Adding filters to the loudspeaker data file, or 2. Tweaking the alpha values within the model.
In Closing
Regarding the reverberation time and material alphas here are some important things to remember:
- “One number” specifications are rarely useful or meaningful. Frequency-dependence must be considered at a minimum.
- Metrics such as T30 are one piece of a large, complex puzzle. Additional metrics such as C50 and STI provide other pieces.
- The RT useful for refining a computer room model to create a sandbox for trying sound system design ideas.
- Material alpha values are estimates. There is much more to the behavior of a material than can be described by a one number rating.
- When building a room model, don’t get obsessed with “exact” absorption coefficients. It’s good practice to under rather than over estimate the alpha of a material.
- An audio signal has a spectrum. An audio component has a frequency response. The spectrum of the signal is modified by the frequency response of the component (or room). For this reason an RIR made with a balloon pop is not suitable for convolution.
