Line Array Attenuation – Ideal vs Actual
Tools of the Trade – By Pat Brown
The selling point of line arrays is that they “defeat the Inverse-Square Law”. Pat Brown decided to test this theory on line array attenuation.
One of the big selling points of line arrays is that they “defeat the Inverse-Square Law.” The ISL states that a point source in a free-field will fall off in inverse proportion to the distance squared, or -6dB per doubling of the distance from the source. A line source will fall off in inverse proportion to the distance, or -3dB per distance doubling (the Inverse Law or IL). I was measuring some short line arrays in the test lab and decided to test the theory.
The Setup
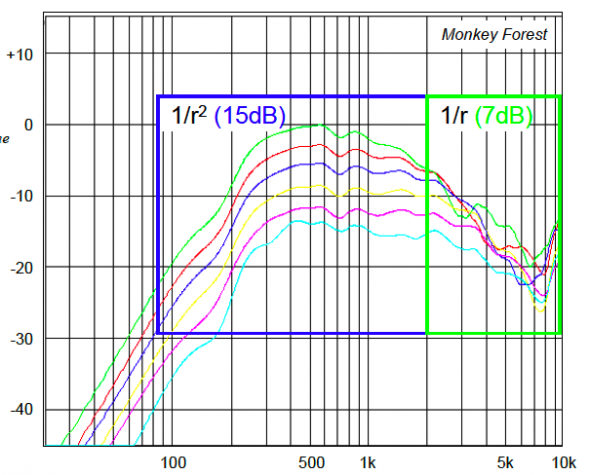
The setup involved a small-format array of approximately 1 meter height. Small, vertically-arranged transducers run from top to bottom. This is a common configuration and the acoustical behavior will be similar for similar devices. I placed the array at one end of the room, and marked off distance ratios of 1.414-to-1, which should produce a 3dB drop per marker (the same relationship that makes a 2:1 distance ratio produce a 6dB drop). The measurements were made at 1m, 1.4m, 2m, 2.8m, 4m and 5.6m – a sufficient number of measurement positions to see the trend in level drop.
Figure 1 shows the overlaid measurements. At -3dB-per distance increase there should be a total of 15dB of level drop between the first and last position via the ISL. A line array would only exhibit one-half of this level change, or 7.5dB between the first and last measurements.
Figure 1 – Axial Response measurements made at 1.4:1 distance ratios. This will produce -6dB per doubling of distance from the source (point source) and -3db per doubling (line source).
Dual-Behavior
Note that the lower frequencies of the bandpass tracked the ISL, and the higher frequencies the IL. This “dual behavior” is not surprising. It establishes the frequency range that the device behaves like a point source and the range that it behaves as a line source. If the array length is increased, the IL behavior can be extended to a lower frequency (at about 1-octave per doubling of length). Many line arrays are configured to facilitate the use of multiples.
Polar Response
Another interesting perspective is to consider what happens to the polar response. A point source produces a polar that does not change shape with increasing distance. The polar of a line source will change in the near-field and become stable in the far-field, where it’s behavior has transitioned to that of a point source. The distances involved, for even this short line array, are too great to practically measure at, so we turn to prediction to observe the behavior. The ARRAY0 module of CATT-Acoustic allows polars to be calculated for any distance from an array. The line array was modeled as a vertical row of discrete sources at the proper spacing, and the horizontal and vertical polars calculated for all of the distances used for the axial measurements in the lab. But why stop there? One of the benefits of modeling is that even greater distances can be considered, so I kept doubling the distance until squarely in the far-field of the array.
A Picture is Worth…
Figure 2 shows the polar behavior for the major octave bands at a distance of 90 meters. Since the polars are distance- dependent, this is of little practical use. Polars at 1.414 distance ratios starting at 1 meter were produced and saved as PDF files. These were assembled into a “book” with one set of polars per page. The PDF can be opened in Acrobat (or work-alike) and the observer can “thumb through” the pages to see how the polars change as a function of distance – a sort of “line array movie.” Fixate on a given octave band as you increment the pages to see how it behaves. Note that at the lower octave bands the far-field is reached quickly (the shape stops changing), but at the higher octave bands the required distance is much greater. Also, the horizontal pattern morphs around a bit due to re-scaling, but in practice it would remain the same for all distances.
Figure 2 – Polars made by constructing a small line array from discrete scources in ARRAYO.
Conclusion
While it may seem that our line array failed us, consider that the desired behavior was achieved in the octave bands important for good speech intelligibility. This explains why small line arrays are a favorite for use in difficult spaces, with the added benefit of being scalable to extend the near-field to lower frequencies and/or greater distances.
A special thanks to CATT-A author Bengt-Inge Dalenback for the array model and the polar concept (which I missed in my axial-only study). This is a great example of where “measurement meets modeling” and how the two can work together to produce the information needed by system designers. pb


